
Other Wikis
- EC Internal Users
- EC Internal Users
During the implementation of an Intervention, Lead Implementing Partners have reporting obligations comprising financial execution and progress achieved at the end of the reporting period. The progress is measured by collecting information via the various Sources of Verification identified in the formulation phase of the Intervention, and the encoding of the latest values (Current Values) available for each Indicator in the Logframe.
This task can be delegated to an Implementing Partner in the Consortium or an Expert, but the Lead Implementing Partner remains responsible for the submission of the values to the Operational Manager.
Through an automated calculation, the health status of each Indicator and the Project as a whole (Logframe-level of the Intervention) is displayed in the form of charts (pie, circular and graph) and colour-coded markers.
A Traffic Light is the health status of the achievement that is either automatically calculated by the system using measurable metrics (e.g. points for Logframes, or dates, base, intermediate and/or target values for Indicators), or manually set - in the case of qualitative indicators or manual mode for Logframes.
These Traffic Lights are established and situated in the system depending on the relevant level (Indicator or Logframe) and application (values for Indicators; indicators for Logframes).
The Traffic Light for a quantitative Indicator is automatically calculated by the system by:
If “Intermediary Target”: (Current Value - Baseline) / (Next Intermediary Target - Baseline)
| Example: | Baseline: 2505 Final Target: 25000 Next Intermediary Target: 15000 Current Value: 12980 | |
Achievement | = (12980 - 2505) / (15000 - 2505) = (10475 / 12495) * 100 = 83.83% | |
If no “Intermediary Target”: (Current Value - Baseline) / ((Final Target - Baseline) * [Time Elapsed Proportion])
[Time Elapsed Proportion] = DiffDay * (Current Value Date, Baseline Date) / DiffDay * (Baseline Date, Final Target Date)
- ( * ) DiffDay is the number of days between two dates.
| Example (in graph image below): | Baseline (1): 2505; Baseline Date: 01 July 2019 Current Value (2): 12980; Current Value Date: 23 January 2020 Final Target (3): 25000; Final Target Date: 30 June 2020 Intermediate Target (4): ? Time Elapsed Proportion = (206 / 365) * 100 = 56.44% | |
Achievement | = (12980 - 2505) / ((25000 - 2505) * 56.44%) = 10475 / (22495 * 56.44%) = (10475 / 12696) * 100 = 82.51% | |

Exception: If Final Target = Baseline (or Next Intermediary Target = Baseline), the Achievement is 0%.
The Traffic Light colours based on Achievement percentage for quantitative indicators are:
Achievement (%): | Indicator Traffic Light: |
|---|---|
[80 ; 100] | On track |
[40 ; 80] | Issue |
[0 ; 40] | Off track |
Please note that if the baseline and/or target value is undefined, the health status is “None” for the Indicator. If an Indicator is disaggregated, only the total of the values is used for the Traffic Light calculation.
The Traffic Light for a qualitative Indicator is manually updated only by the Operational Manager (justification required).
The Traffic Light colours based on Achievement status for qualitative indicators are:
Achievement Status: | Traffic Light: |
|---|---|
Met | On track |
Partially Met | Issue |
Not Met | Off track |
Please note that if an Indicator is disaggregated, only the total of the values is used for the Traffic Light calculation.
The Traffic Light for a Logframe is automatically calculated by the system by:
1. Taking the point for each Indicator of the Logframe based on the Traffic Light for each Indicator;
Indicator Traffic Light: | Points: |
|---|---|
On Track | 2 |
Issue | 1 |
Off track | 0 |
2. Calculating the average for the points for all the Indicators of the Logframe.
| Example: | Indicator 1: On track Indicator 2: On track Indicator 3: Issue Indicator 4: On track Indicator 5: Off track Indicator 6: Issue | |
Average | = (2 + 2 + 1 + 2 + 0 + 1) / 6 = 1.33 | |
The Traffic Light colours based on Average for Indicators for the Logframe are:
Achievement Status: | Logframe Traffic Light: |
Met | On track |
Partially Met | Issue |
Not Met | Off track |
Please note that if at least one Indicator has no value (i.e. undefined or not approved), the health status is “None” for the Logframe.
Operational Managers can override (i.e. “manual mode”) the Traffic Light of a Logframe (a justification is required).
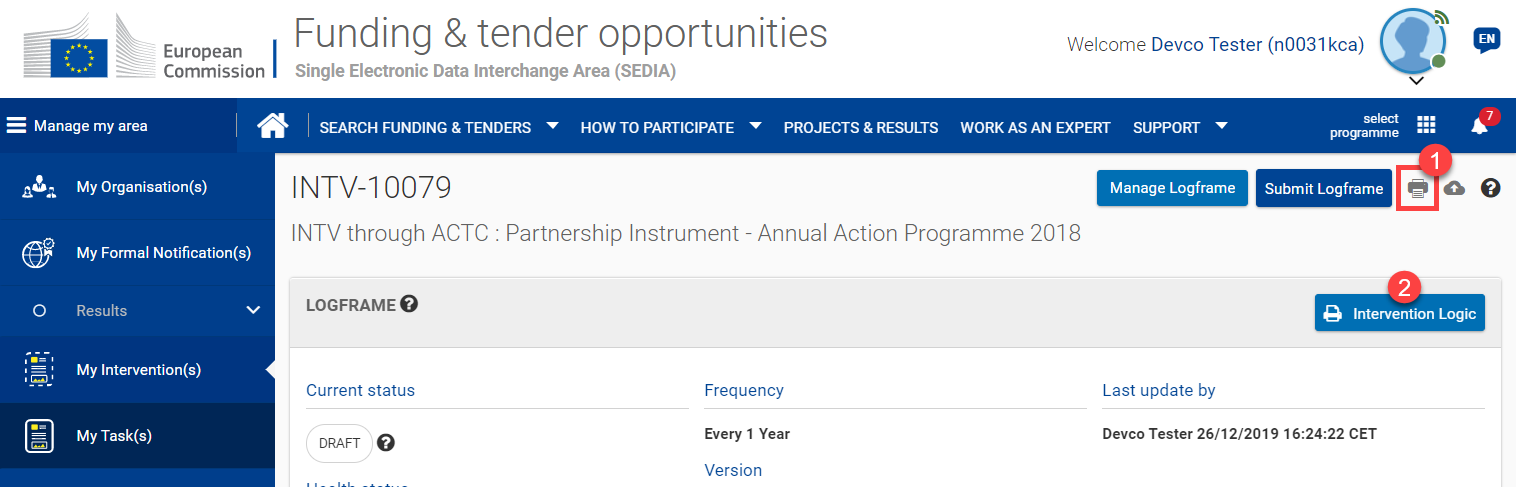
The Logframe or Intervention Logic may be printed for reporting purposes.
To print a Logframe first access the Logframe as described in Chapter 4.1.1.1 – How to access a Logframe.
Once you have accessed the Logframe, click either on the print icon (1), or the “Intervention Logic” (2) button.
The Logframe is displayed in “REVIEW MODE”, and you can click on the “Print” button at the bottom right of the page to print the Logframe.

