
Other Wikis
- EC Internal Users
- EC Internal Users
An online guidance for building strong logical frameworks - identifying SMART results and measurable indicators - in line with INTPA priorities for the given sector.
This Guidance can be used to design results chains by helping to formulate output, outcome and impact statements, along with corresponding indicators. Its main objective is to enhance the quality of INTPA interventions – both in terms of design as well as of monitoring and reporting in the course of implementation. It offers a starting point for LogFrame design and its content needs to be adjusted to the local context.
The Guidance can be used at formulation stage to build the Action Document or intervention LogFrame. It can also be used for LogFrame revision during implementation.
The Guidance was designed for Operational Managers and Implementing Partners involved in the preparation of Action Documents and project documents (Description of the Action).
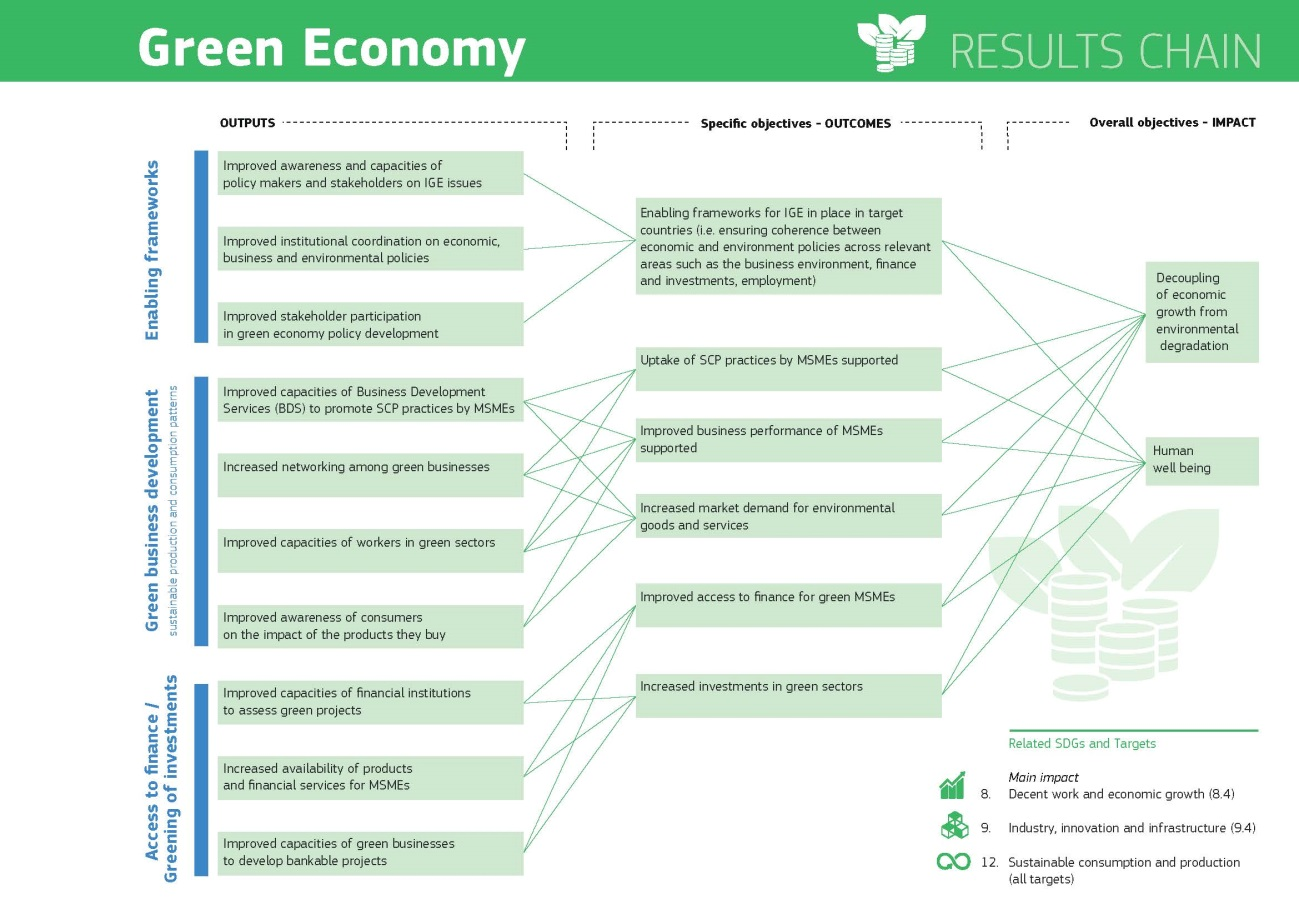
It offers a very practical and user-oriented approach. The result chain is presented as a dynamic diagram allowing the user to easily see the links among the different result levels – Impact, Outcome and Output – and the list of associated indicators with the relevant data source. The Guidance also includes indicators from the EU Results Framework and SDGs whenever relevant to the sector. It is regularly reviewed to ensure alignment with INTPA policy priorities.
For each sector, the Guidance provides: (A) a diagram of the results chain, which reflect EU policy priorities as from key development policy documents; (B) a short narrative explaining the underlying approach; (C) a set of key indicators associated to each expected result from the results chain. The list of indicators can be downloaded as an excel file, while the results chain is also available in pdf. Additionally, a brochure in pdf is available for each sector.
Figure 3: Example of a results chain
Data/Information
Data sources are provided for each indicator. In most cases – in particular at output and outcome level – indicator data source comes from intervention's own monitoring and reporting system (progress reports, baseline and endline surveys conducted by the Action, etc.). At impact level, data can come from national-level statistics, government information systems and reports from international agencies and donors.
Time
N/A
Skills
N/A
Facilities and materials
N/A
Financial costs and sources
N/A
Tips and tricks
The result chain is presented as a dynamic diagram: a click on any result statement will highlight its links with outputs and/or outcomes. Double clicking any result statement opens the list of relevant indicators.
Capacity4Dev: Results and Indicators for Development
The European Commission (EC), DG INTPA, Result-Oriented Monitoring (ROM)
The European Commission (EC), DG INTPA, Guidance on internal monitoring for results
My INTPA: Corporate Results Framework ![]()

