Data can be visualised by means of:
A table, usually for GEO and TIME dimensions,
Charts, such as bar char and line chart,
Map,
Time series table. (not activated in Eurostat)
For most visualisations, several options are available to tailor the data consultation.
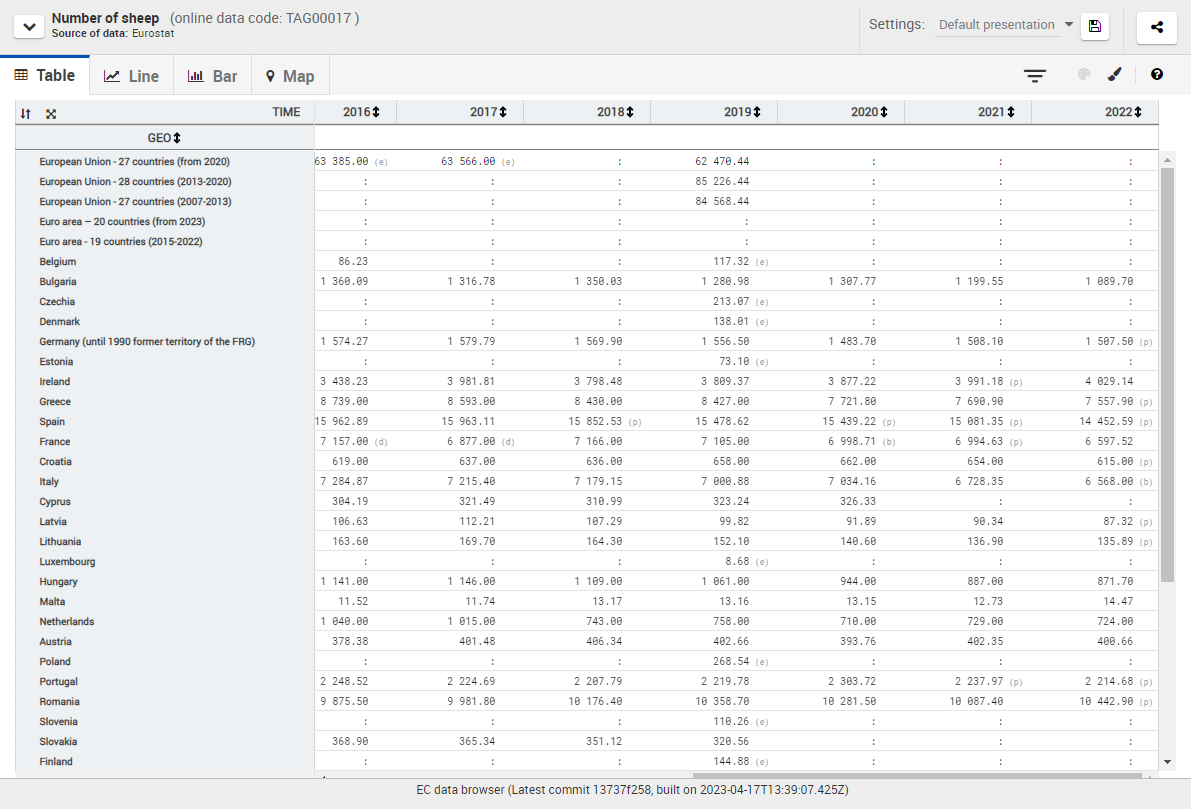
Example for the table:
swap the axis,
change the layout configuration,
set the number format etc.
The details on how to manage each visualisation are described in the next sections.
At any time, it is possible to click on ![]() to reset the view. Resetting the view sets all settings to default, including the visualisation mode (which returns to Table).
to reset the view. Resetting the view sets all settings to default, including the visualisation mode (which returns to Table).
In case no modification to the layout has been performed, the button to reset is not displayed.
The Selection tab
The Selection tab is used to:
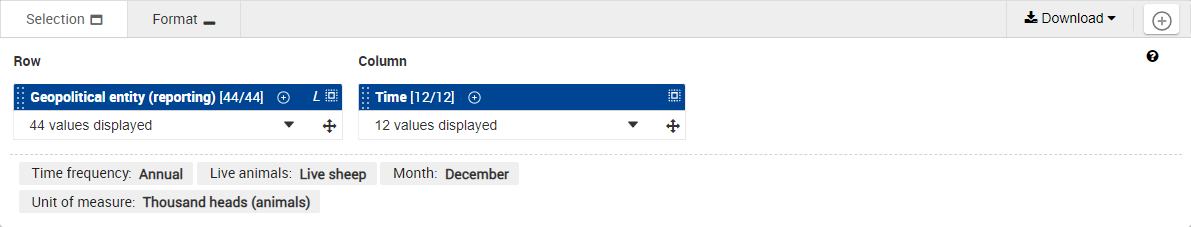
Determine which dimensions (TIME, GEO, etc) will be used in the layout
In the example above, the Time and Geopolitical entity dimensions are set as layout dimensions
For each of these dimensions, it will be possible to select one or more positions. In the example above:
There are 10 positions selected out of 10 for Time dimension
All the 59 available positions for Geopolitical entity dimension are selected
The names of the dimensions set in the layout are displayed on a blue background
Determine which dimensions will be contextual, in other words, used as context of the displayed data. They are displayed under Page.
In the example above, Demographic indicator is set as Page (context) dimension
For each of these dimensions, it will be possible to select only one position at the time. In the example above:
For the Demographic indicator dimension, the Population on 1 January - total is the selected position (out of 5 available)
The names of the dimensions set as Page (context) are displayed on a gray background
How to set a dimension as Layout dimension or as a Page dimension?
All the dimensions available are always displayed by the Data Browser.
To move a dimension from one place to the other:
Left-click on the name of the dimension which has to be moved
Perform a drag and drop of this dimension to the destination place
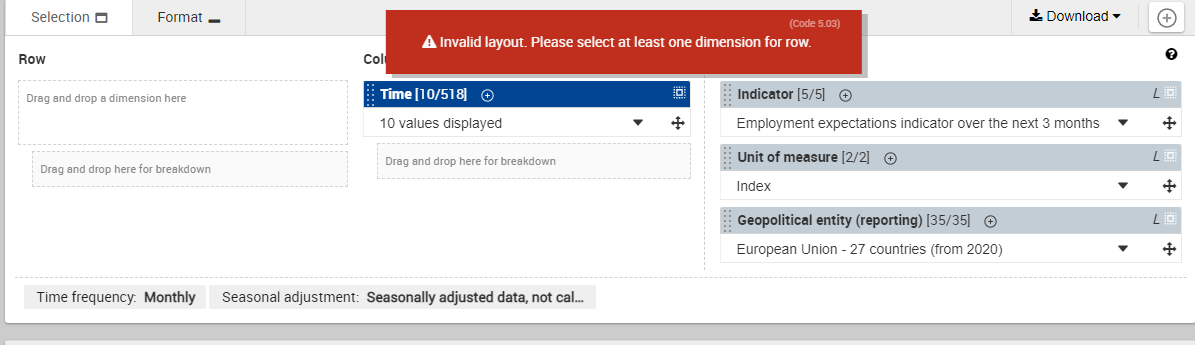
It is important to remember that, for each type of visualisation, there are rules which forbids some situations or combinations on dimensions.
For example, when the user is in Table visualisation, the Data Browser will completely disable visualisation if Column and Row don’t both have a corresponding dimension:
What are Breakdowns and how to use them?
In Table visualisation, it is possible to define breakdowns, in Column and Row. Breakdowns provides the ability to add another dimension to the ones already present in Column and Row, displaying then 3-dimensional or 4-dimensional tables.:

See this page for more information about this feature.
The Format tab

The Format tab contains the formatting options. Using these options, the user can customize many display features to get to the desired result.
There are two kind of format options:
The general options: these options apply to all the visualisations simultaneously.
The visualisation-specific options: each visualisation has specific formatting options which do not apply to the other visualisations
General options
Labelling
Labelling options. Sets the labels for positions of the dimensions. Available options are:
Labels (default value) : View the labels of the dimension positions.
Codes : View the codes of the dimension positions.
Codes and labels : View the codes and labels of the dimension positions.
Dimension specific: Determine for each dimension the labelling mode to be used. When selecting Dimension specific, the Dimension specific labelling modal opens:

Select the labelling to be applied to each dimension then click onClose.
This feature does not apply to the Time dimension.
Decimal symbol
Decimal symbol options. Sets the decimal symbol. The decimal symbol is used to separate the integer part from the fractional part of the displayed statistical values. Available options are:
dot (.) (default value)
comma (,)
Thousands symbol
Thousands symbol options. Sets the thousands symbol. The thousands symbol is used to separate each thousands group when displaying the statistical values. Available options are:
comma (,) (default value)
dot (.)
Blank space
none
The selected Decimal symbol and the selected Thousands symbol cannot be the same. The Data Browser will automatically prevent this situation to happen.
Visualisation-specific options
The visualisation-specific options are described in each of the pages dedicated to visualisations:
Highlighting positions
In some of the visualisations (Table/Bar/Line), it is possible to highlight positions.
Once a position is highlighted, it will appear as such in all of those three visualisations (it has however no impact on Map nor on Time Series visualisations)
Each help page corresponding to one of those visualisations describes:
How a highlighted position will appear
How to highlight/unhighlight a position
Please notice that highlighting has no impact on the Selection tab
The highlighting uses a palette of colors, which will provide an information which is easier to visualize.
To do this, click on ![]() at the top of the chart and select the positions to be highlighted:
at the top of the chart and select the positions to be highlighted:

Alternatively, you can select to highlight the default positions, by clicking on Apply defaults

To close the window, click on ![]()
When the Highlight mode is activated, the dimension dropdown contains a third mode: Highlighted.

In this list:
When a position is checked, it means it is highlighted
When a position is not checked, it means it is not highlighted
Moreover, when this mode is activated, every section (Highlighted/Selected/Available) of the dimension dropdowns display a colored background on each highlighted position.
Interactivity limit
The interactivity limit is a technical limitation of the Data Browser. The Data Browser is not able to display, in the visualisations it provides (Table/Bar/Line/Map/Time Series), datasets which contain more than 750.000 cells ("cell" has to be understood as any statistical data, including the "no data available" (":") data). These datasets are called non-interactive datasets.
If the user tries to display such dataset in the Data Browser, an error message will be displayed: "The current estimated cube size is above the limit of 750000 cells. This may impact the speed of data rendering. It is recommended to use one of the datasets or to create a custom dataset".
However, the following actions are always accessible, even for such datasets:
Create custom dataset (see this page for more information)
Download statistical data and structural items (see this page for more information)