Data visualisation
Click on Time series tab to visualise the data as time series:
![]()
Here is an example of Time series:

There is a technical limitation in the Time series visualisation. The maximum amount of items displayable in the Time series filter dropdown is 10 000 items. This does not have impact, however, on the amount of keys displayable in the Time series table.
This limitation adds up to the interactivity limit (see this page).
Special values and Flags
Under the Time series table, the following items are always displayed:
Special values. Special values are values that can be present in the data cells. They do not represent statistical data, but they replace them. Existing special values are the following:
":": When the colon is present, it means that there is no data available in this cell. For example:

In this example, no data is available for Belgium (BE) in 2007.
Flags. Flags are metadata which provide additional information about a specific statistical data. When present, this additional information is required for a correct interpretation of the data. For example:
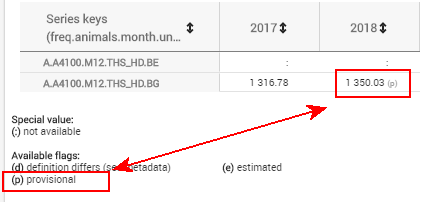
In this example, the statistical data of Bulgaria on 2018 (1 350.03) should be considered as provisional (because of the (p) flag).
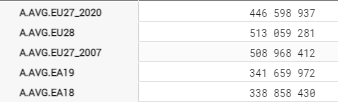
Flags can be combined:
![]()
In this example, the statistical data for European Union in 2018 (446 598 937) should be interpreted as being estimated and provisional altogether.
Format options
Click on Format (in the Actions area) to set the different format options of the time series:
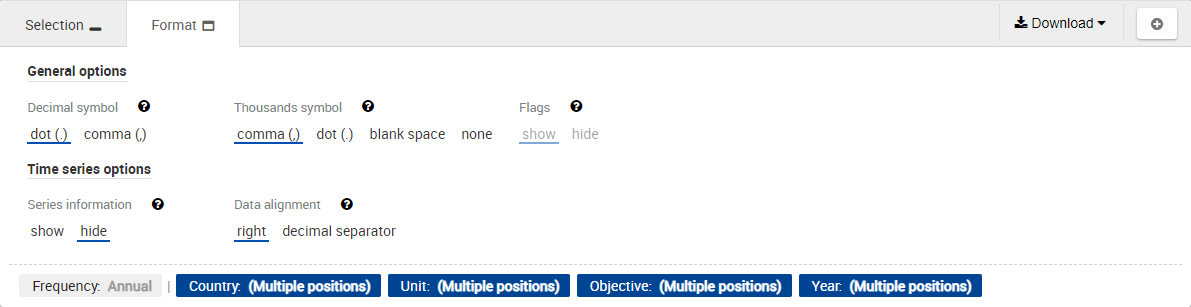
Labelling options, Decimal symbol options and Thousands symbol options are described on this page.
The Labelling selector is only available when Series information (see below) is set to Show.
Flags options
Show: Show flags:

Hide: Hide flags:
Series Attribute options
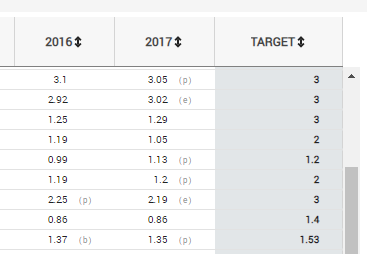
Some datasets contain a Series attribute. It may, for example, represent an objective to be reached in the future ("TARGET").
When Show is selected under Series Attribute, the attribute is represented in the time series visualisation:
Series Information options
The Series information column provides the details on the combination of positions which are incorporated in the considered serie key (cf. the Series keys column on the left).
Show: Show the Series information column:

Hide (default value): Hide the Series information column:
