Import remarks
This feature is available only for the Table visualisation.
This feature is available only for datasets which include more than two dimensions.
Click on Table tab to visualise the data within a table:

The table displays:

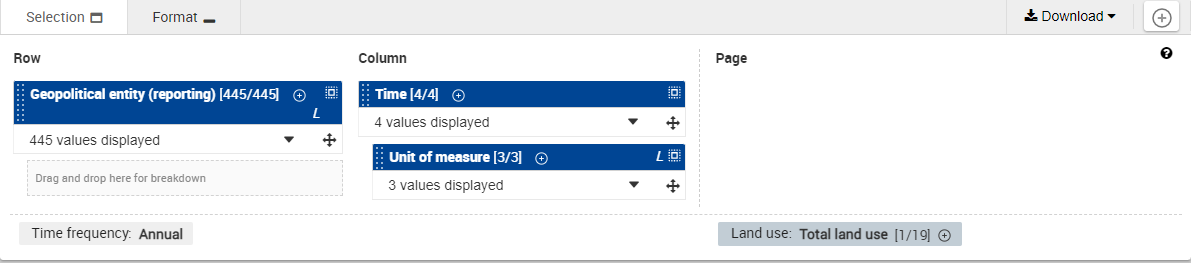
Click on Selection tab:

Drag the desired additional dimension from the Page column and drop it on the Drag and drop here for breakdown area. In the example below, Land use dimension was drag-and-dropped as a breakdown in Row:

The result is:

Multi-dimensional support and visualisations
The multi-dimensional view feature is only available in Table visualisation. The Bar and Line visualisations only support two dimensions at the same time.
In some cases, when you define breakdowns (= selects 3 or 4 dimensions) in Table, then switch to another visualisation mode, you won’t be able to change the layout (dimensions) as long as you don’t come back to Table. However, it is still possible to modify the selected positions/values in each dimension.
Example:
Step 1: Initially, the table in the example displays with two dimensions: TIME (in Column) and GEO (in Row).

Step 2: The user changes the layout: he adds the Land use dimension as breakdown in Column.
Step 3: If the user tries to go to the Line visualisation, an error message is displayed, and the breakdown inserted before (Land use) is fixed to one value and located in Page part, which allows to display the line chart. The user cannot however change the layout while in Line in this case:

Step 4: If the user goes back to Table visualisation, he gets back the breakdown previously defined. He can then remove the breakdown (by moving back Land use dimension to Page part). Once the breakdown is removed from Column, the user can switch to Line again. The breakdown having been removed, the user is able to change the layout again (on Series part):
