The following instructions refer to the Dataset detail page
Data visualisation
Click on Table tab to visualise the data with a table:
![]()
There are some technical limitations in the Table visualisation:
The maximum amount of columns (including breakdown if used) is 2 000
The maximum amount of rows (including breakdown if used) is 2 000
The maximum amount of cells is 120 000
If one tries to overtake this limit, an error message will be displayed.
This limitation adds up to the interactivity limit (see this page)
Special values and Flags
Under the table, the following items are always displayed:
Special values. Special values are values that can be present in the data cells. They do not represent statistical data, but they replace them. Existing special values are the following:
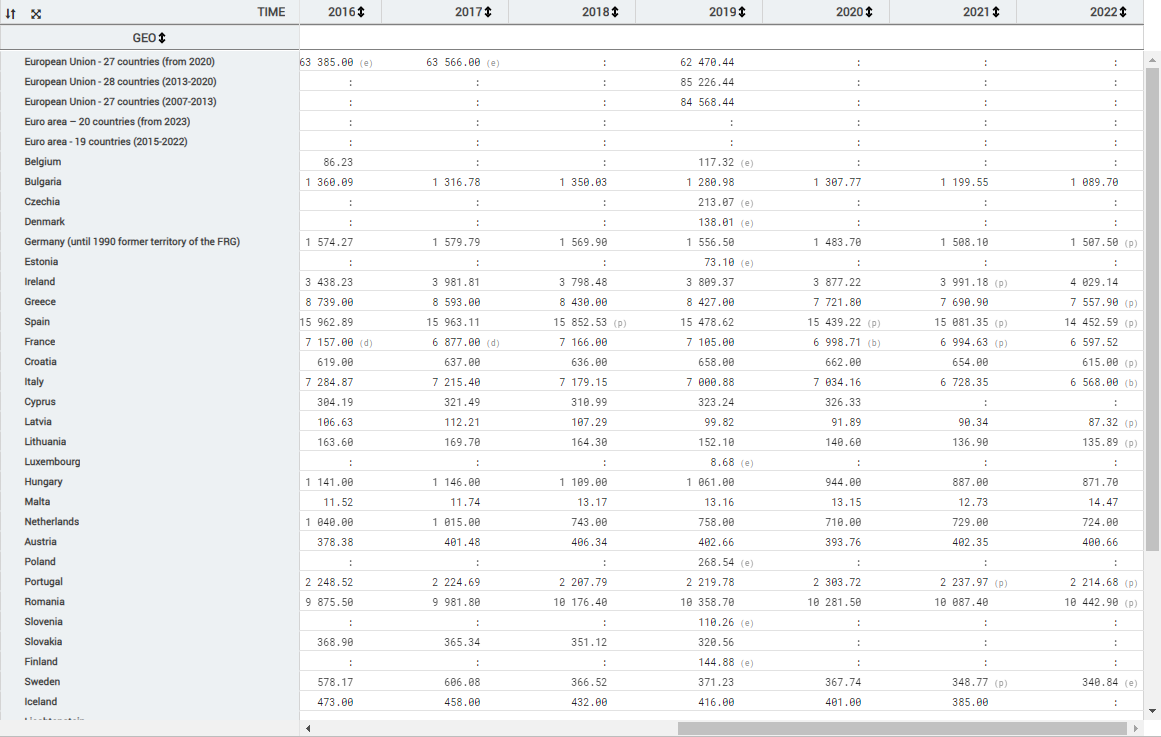
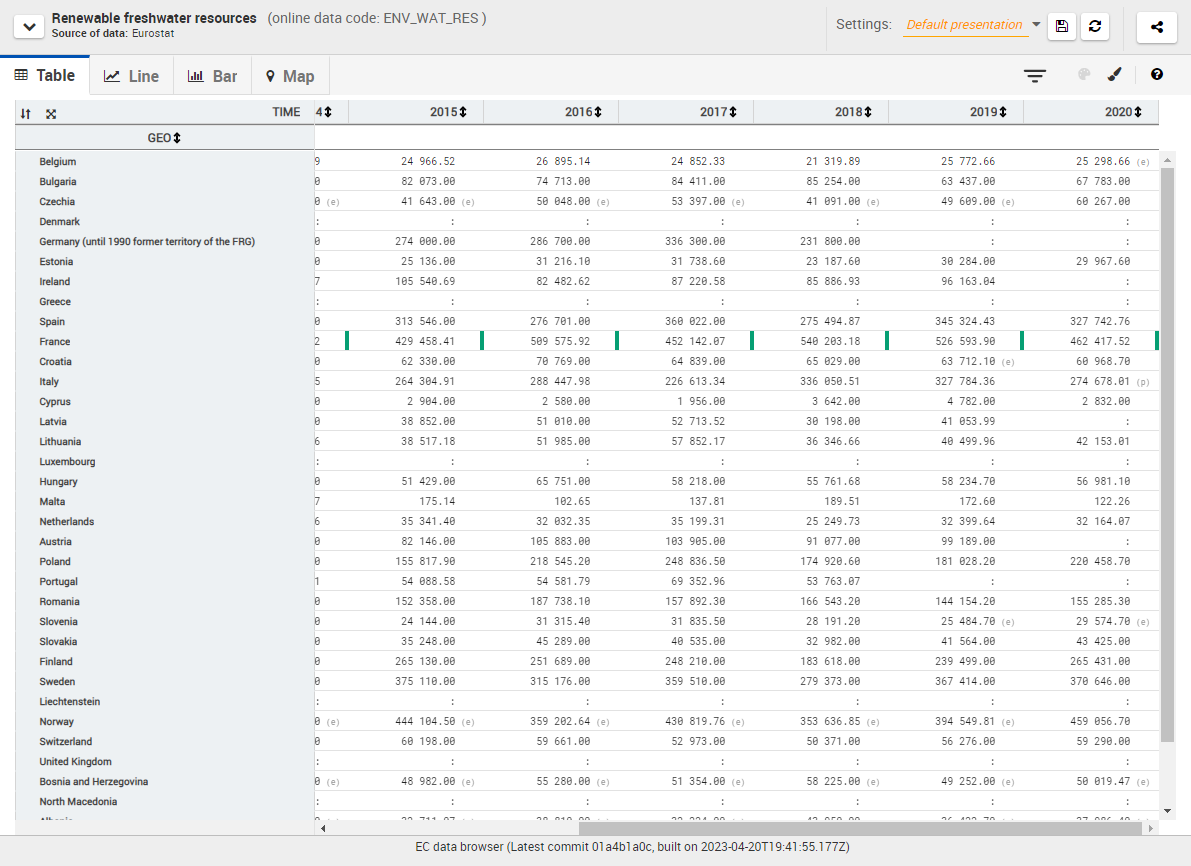
":": When the colon is present, it means that there is no data available in this cell. For example:

In this example, no data is available for Belgium in 2017.
Flags. Flags are metadata which provide additional information about a specific statistical data. When present, this additional information is required for a correct interpretation of the data. For example:

In this example, the statistical data of Spain on 2018 (15 852.53) should be considered as provisional (because of the "(p)" flag).
Flags can be combined:

In this example, the statistical data for European Union in 2017 (154 792.75) should be interpreted as being estimated and provisional altogether.
Format options
Click on Format tab to set the different format options of the table.
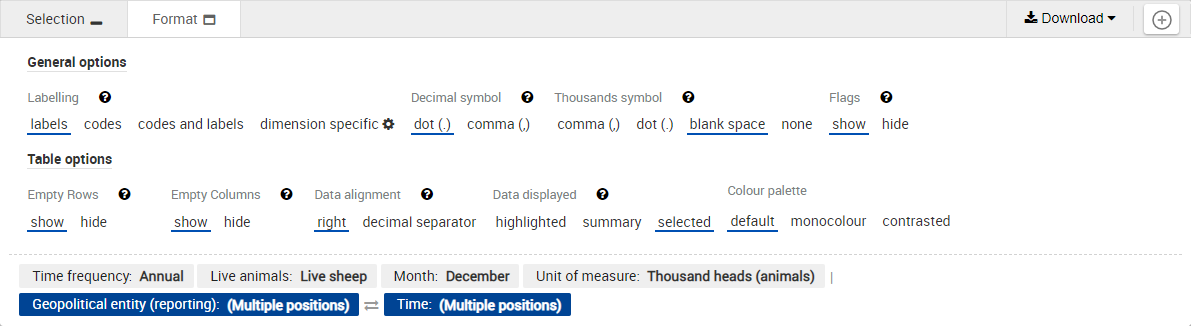
Labelling options, Decimal symbol options and Thousands symbol options are described on this page.
Flags options
Show (default value): Available flags are shown in brackets after the figure they are referring to. The legend is available at the bottom of the table.
Hide: Flags are hidden.
Empty rows options
Show (default value): The empty rows are displayed

Hide: The empty rows are hidden

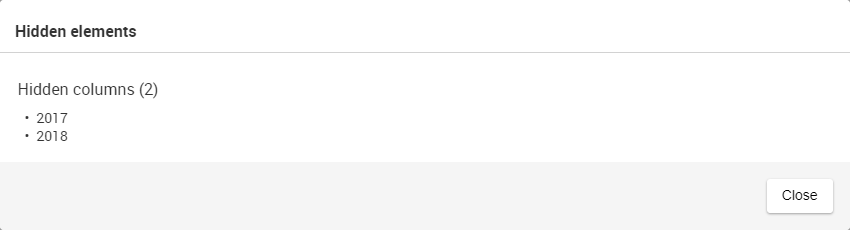
If one or more row/column is masked using this option, an orange exclamation mark (![]() ) appears at the top right of the table. When clicking on this button, a modal appears, showing the list of currently hidden elements:
) appears at the top right of the table. When clicking on this button, a modal appears, showing the list of currently hidden elements:

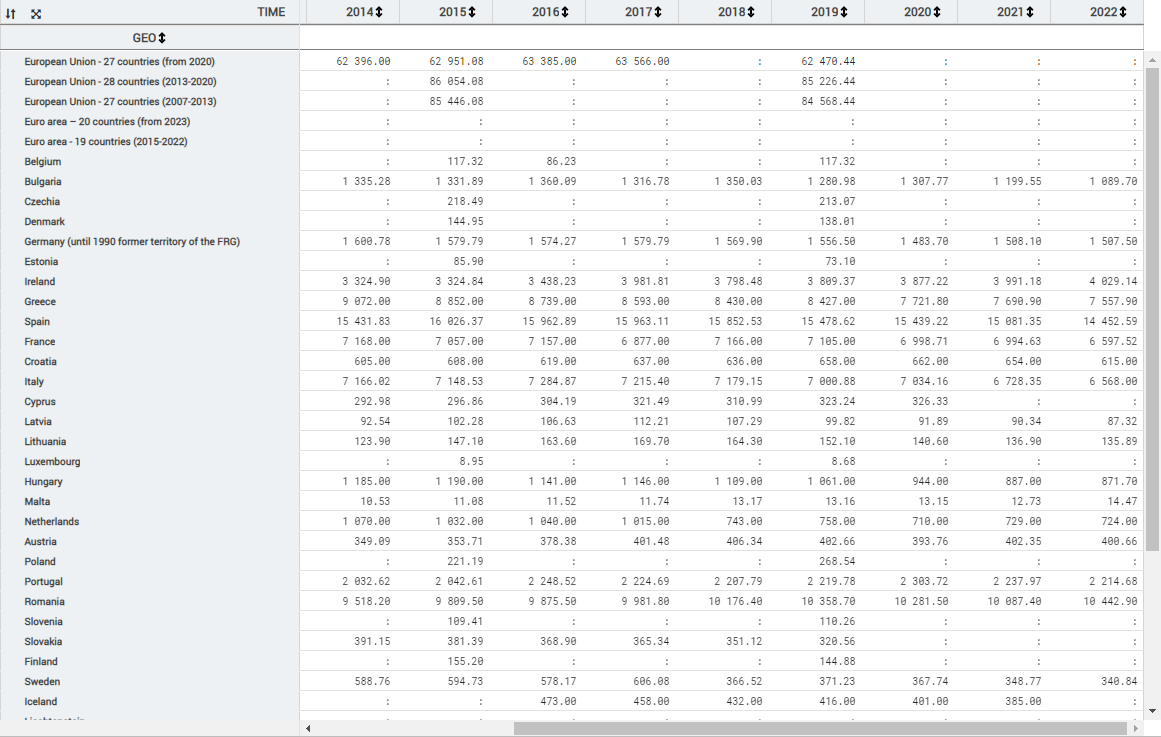
Empty columns options
Show (default value): The empty columns are displayed

Hide: The empty columns are hidden

If one or more row/column is masked using this option, an orange exclamation mark (![]() ) appears at the top right of the table. When clicking on this button, a modal appears, showing the list of currently hidden elements:
) appears at the top right of the table. When clicking on this button, a modal appears, showing the list of currently hidden elements:
Data alignment options
Available options are the following:
Right (default value): Statistical data is aligned on the right of each cell:

Decimal separator: Statistical data is aligned on the decimal separator:

Series Attribute options
Some datasets contain a "serie attribute". This attribute provides additional information, like:
TARGET: Objective to reach
LTAA: Long-Term Annual Average
When displaying such dataset in a Table, the serie attribute will be visible as an additional column, at the extreme right of the screen. Example with a TARGET serie attribute:

Data displayed options
Highlighted
The Highlighted mode allows the table to display only the positions currently highlighted (from highlighting done by the user in another visualisation or the current table visualisation). In Table, this mode is applied to the positions of the dimension set in Row.
In order to add/remove positions to the table while in this mode, an additional menu is required. This menu is activated by clicking on the brush icon (![]() ). It renders a list showing to the user the current selection of positions. The ones currently highlighted and thus visible in the table are in bold. A position can be added/removed by clicking on its item in the list.
). It renders a list showing to the user the current selection of positions. The ones currently highlighted and thus visible in the table are in bold. A position can be added/removed by clicking on its item in the list.
It is also possible to highlight a row (position) by double-clicking on the head of the row (in the gray-background column). The same action, performed on an already highlighted row, will remove the highlight on this row.
In case the table is accessed while there are no highlighted positions, the following rules will apply to ensure a baseline table is rendered:
In case of a non-GEO dimension, the serie having the highest value of the most recent time period is taken. So the table starts with one serie rendered.
For the GEO dimension (or with a related dimension) and in case aggregates are present in the selection, the most relevant EU and EA aggreates are selected. So the table starts with two series rendered.
For the GEO dimension (or with a related dimension) and in case no aggregates are present in the selection, again the serie having the highest value of the most recent time period is taken, first among the EU member states or then on the full selection. So the table starts with one serie rendered.
It is also possible to manage which positions are highlighted and which are not by using the dimension dropdowns (see this page for more information).
Summary
The Summary mode allows the table to display a summarized version of the selected data.
The summary is built on the following principles:
Among the selected positions, the following positions are the only ones displayed in the table, on the basis of the last available statistical data for each row:
Top eight rows
Eight average middle rows
Bottom eight rows
In this mode, all the other rows are hidden.
Rows corresponding to positions for which no statistical data is available at all will not be taken into account into this calculation.
To activate this mode, select Summary in the Data Displayed selector.
Example
When the Summary mode is activated, the result is the following:
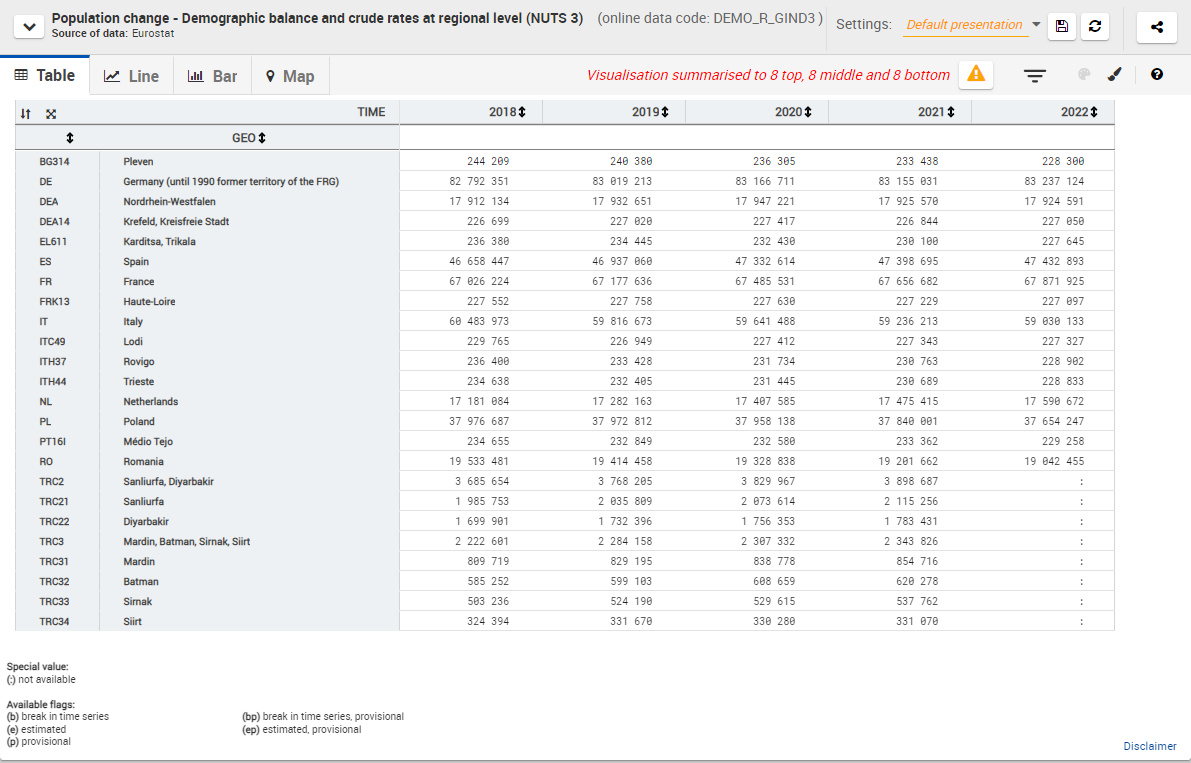
The amount of positions selected in the “Selection” tab does not change. However, only the rows corresponding to the "Top 8 - Middle 8 - Bottom 8" rule exposed above will be displayed. All the other rows are masked.
A warning message is also displayed above the table (orange background). When clicking on it, or when clicking on the
 button, modal will be displayed, listing all the positions for which no row is currently displayed because of the Summary mode.
Selected
The Selected mode allows the chart to display all the positions from the selection into the table.
Rows are rendered:
with a completely white background if they are not highlighted
with a background with a small color line if they are highlighted
Other layout actions
Other layout actions are available in the table:
Position the cursor of the mouse on any boundary of the columns headings to make the resize icon
 appear.
Move the boundary to adjust the column width.
Double click on the boundary to minimise the column width.
Click on the title of the dimension in Row to change the sorting of the positions. Available sorting orders are:
Default sorting order, represented by
 (for example, the default sorting order for the GEO dimension is the Protocol order)
Descending (9→0) / Reversed alphabetical (Z → A) sorting order, represented by
 (appears on the extreme right of the header of the dimension in Row)
Ascending (0→9) / Alphabetical (A→Z) sorting order, represented by
 (appears on the extreme right of the header of the dimension in Row)
Click on the header of any column to sort all the displayed data on the basis of the data contained in this column. Available sorting orders are:
No sorting based on this column (default situation)
Descending (9→0) sorting order, represented by
(appears next to the title of the column)Ascending (0→9)sorting order, represented by
(appears next to the title of the column)Please notice that, when sorting, an absence of value (represented by ":") is considered as a value greater than any other value
Highlight options
In the Table visualisation, it is possible to use the highlight feature (see this page)
How do the highlighted positions appear in Table?
Example:
How do I change the highlight of a position?
It is only possible to highlight rows. Highlighting column positions is not possible.
To highlight a position, double-click on the gray cell header at the left of the row.
To remove the highlight of a position, the same operation must be performed.