More information on selection modes can be found on this page.
For various reasons, the agency who manages a dataset may not make immediately available the contents of whole dataset in the Data Browser. The effect of this is to have less positions available in the selection dropdowns than what is really available in the full dataset.
It is however possible to gain access to other parts of the dataset via the Data Browser interface. To do so, it is necessary to create a Custom dataset. The Custom dataset provides the ability to select a specific data cube, by picking, for each dimension of the dataset, the desired positions among the ones available in the dataset.
In the Dataset detail page, click
 at the top right of the actions section:
A popup similar to this one then appears:
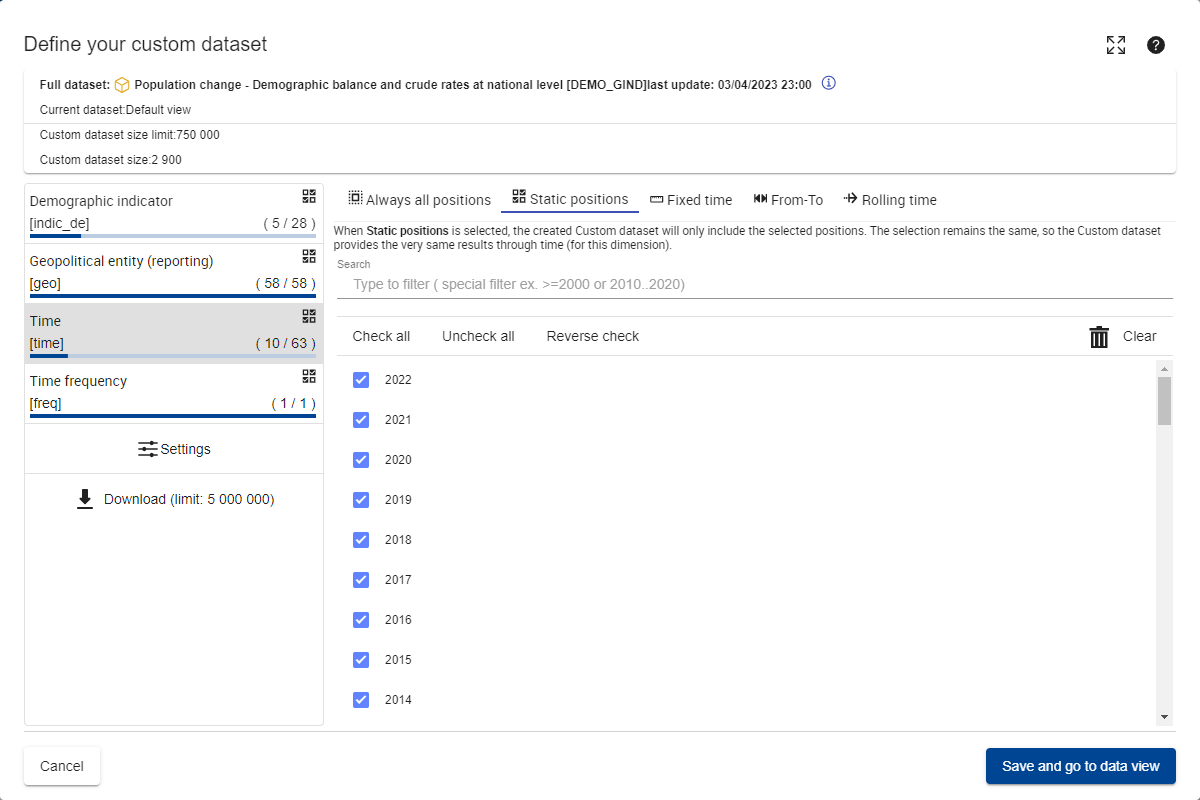
The left part lists all the dimensions. For each dimension, the system displays:
The label of the dimension
Between brackets, the code of the dimension
The amount of positions currently selected and the amount of selectable positions (X/Y)
At the top right corner, the icon which represents the currently selected selection mode for the dimension (see this page for more information on selection modes)
Click on each dimension to select the appropriate selection mode. Depending on the selected selection mode, various options can appear:
Always all positions: No specific option is available
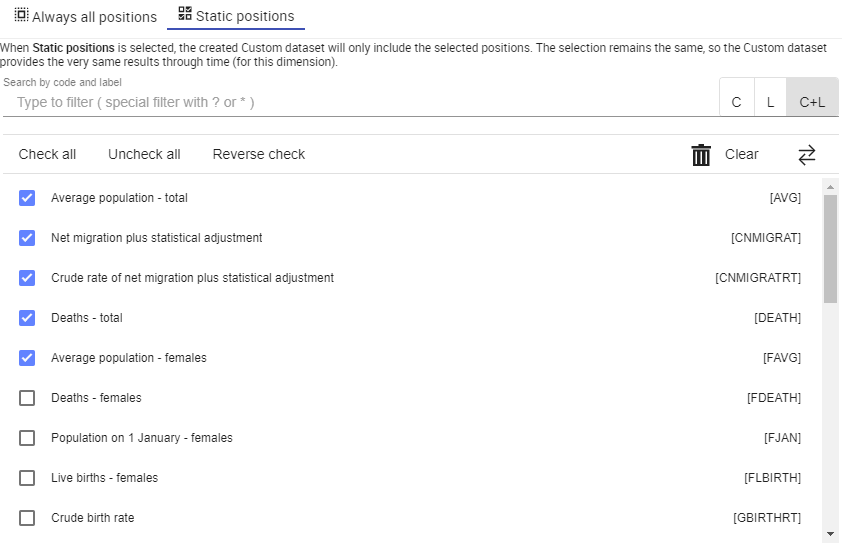
Static positions: Check in the list all the necessary positions. The selectors and the search feature work as previously described in the visualisation page of the Data Browser (see this page for more information).
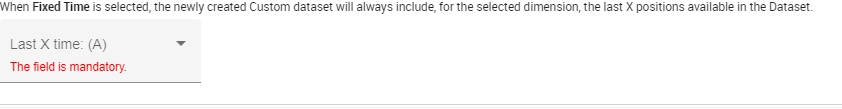
Fixed time (only available on Time dimension): Select the “Last X Time” value.
From-To(only available on Time dimension). Select the Start Time and End Time which match respectively the beginning and the end of the desired timespan interval.

In case of multi-frequency dataset, the user will have to select a Start Time and an End Time for each of the selected Time frequencies.
In every case, the label of the dropdown lists mentions to which frequency the dropdown list is linked (“A” for “Annual” in the example above)
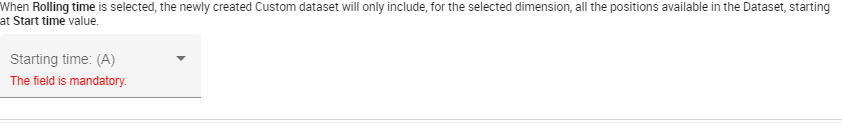
Rolling Time(only available on Time dimension). Select the Start Time which matches the beginning of the desired timespan interval.
In case of multi-frequency dataset, the user will have to select a Start Time and an End Time for each of the selected Time frequencies.
In every case, the label of the dropdown lists mentions to which frequency the dropdown list is linked (“A” for “Annual” in the example above)
Once all the required settings are set (i.e. at least one selected mode and one position for each dimension), please click on Save to My data and go to data view to create the custom dataset and open it directly in the Data Browser.
Once having selected the selection mode and at least one position for each dimension, on the top part of the modal, the "Custom dataset size" will mention how many (potential) statistical values are present in the current selection (2 655 in the example below):

For technical reasons, it is currently not possible to display datasets containing more than 750 000 (potential) statistical values. Consequently, it will not be possible to create custom datasets whose the size (at time of custom dataset creation) exceeds this ceiling value.
When opening the modal to create a custom dataset, the software will pre-check the selection modes and the positions as already selected in the dataset currently visible in the Data Browser. The user is of course free to change these settings if necessary.
In case several dimension codes are selected and no data is available for one of them, a ! will be displayed next to it when selecting:
The Highlight options:

The drop-down list of codes in the Selection section:

When Time dimension is in Page column, then the selection is kept in the URL query parameters.
In case, the selected time position is not part of the resulting data view, then a warning is displayed and the last time position is selected.