Discover Data Browser interface
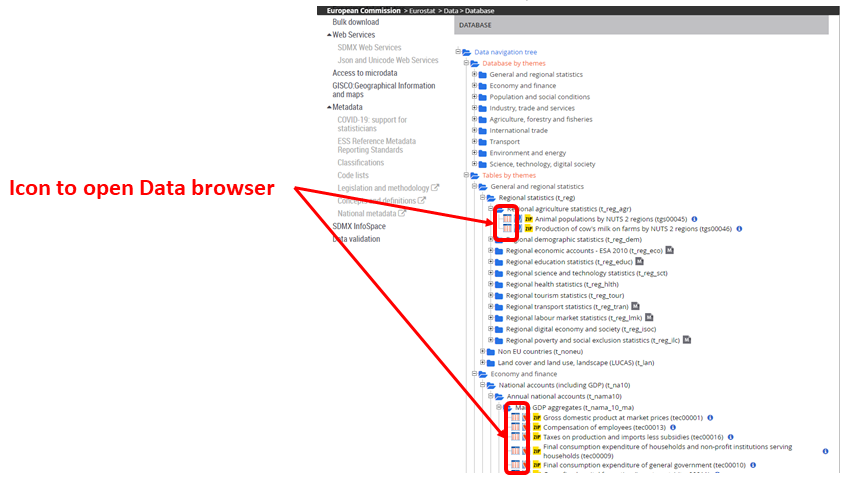
How to come here from Eurostat website?
From Eurostat website following the “Data > Database” menu
Global layout

Online help
Data Browser provides contextual help, available for all functionalities, by clicking the "Help" button
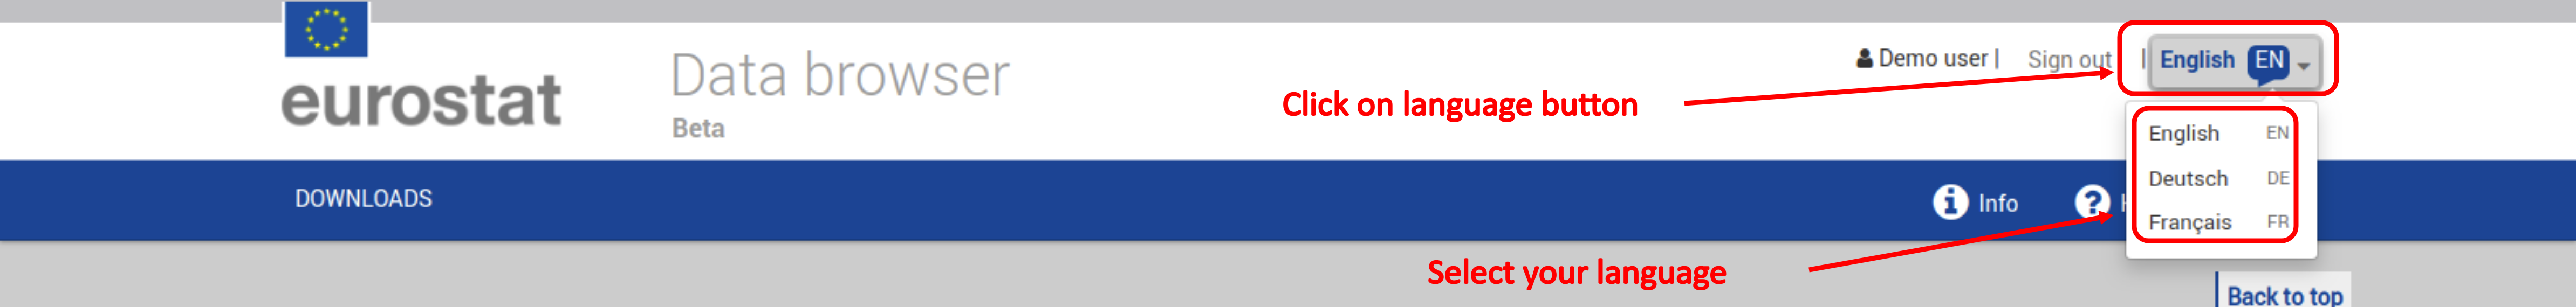
Choose your language
3 possible languages:
English
German
French
Information
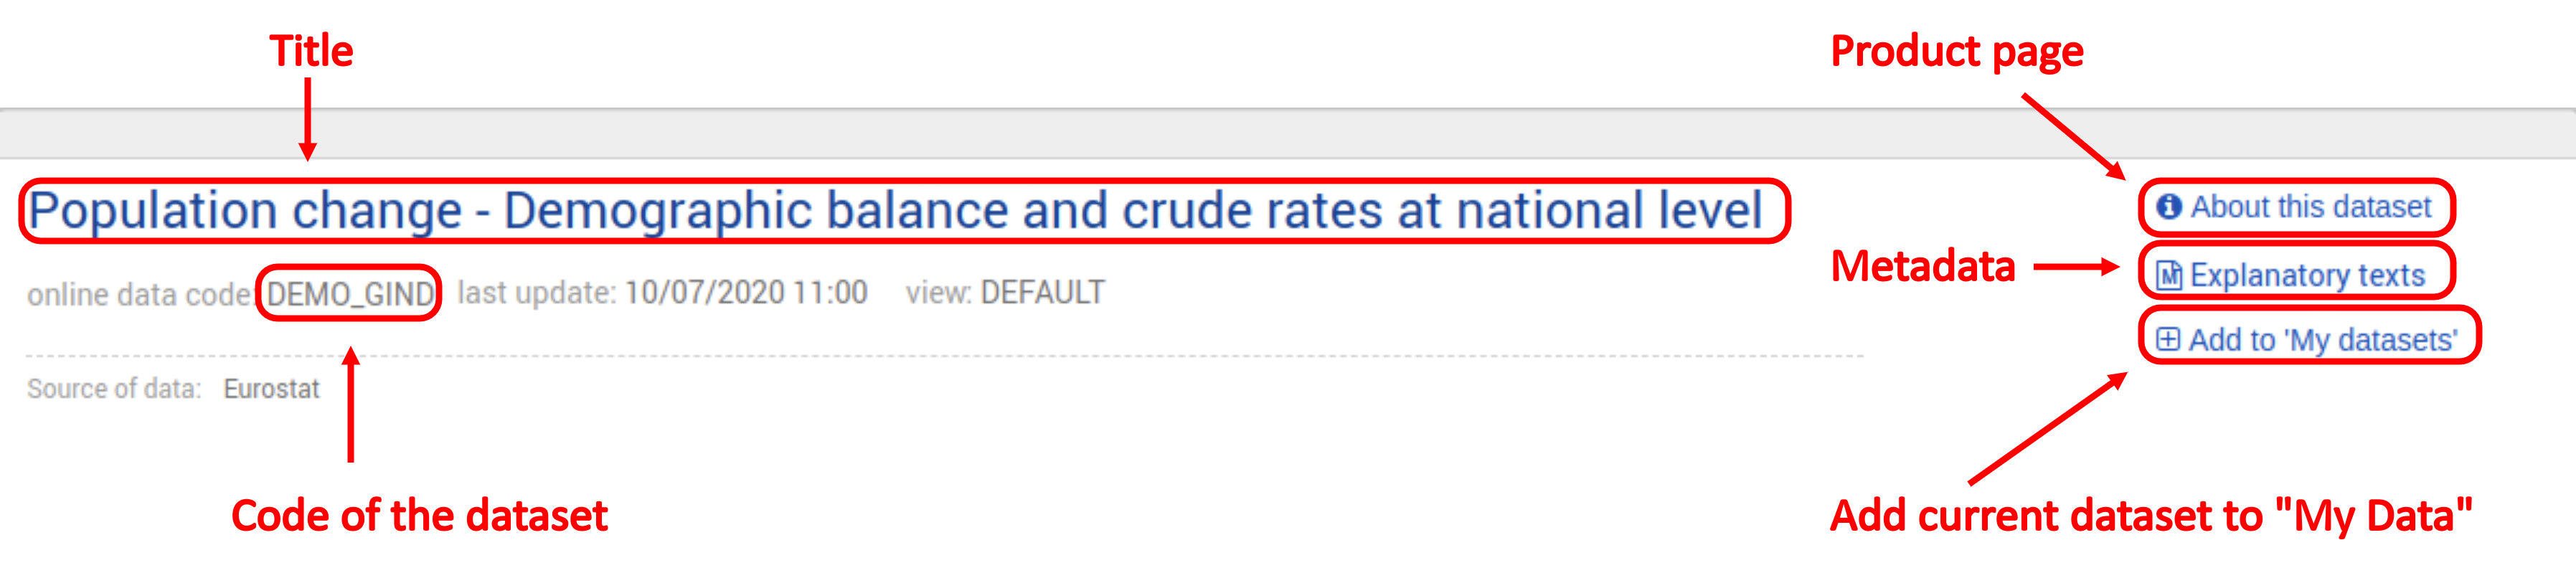
Information - Metadata
Click the "Explanatory text" icon to view the dataset’s metadata; this information is displayed in a new page

Information - About the dataset
Click "About this dataset" to view metadata information about the dataset

Actions - Selection

Actions - Selection - Customize layout for visualisations
Online help: How to customise the data visualisation?
Change layout via selection tab

Actions - Selection - Data selection
It is possible to filter the data you want to display without creating a new dataset. This feature is described in the Online help:
Actions - Selection - Single selection

Actions - Selection - How to filter Time dimension ?

Actions - Selection - How to filter geographical dimension ?

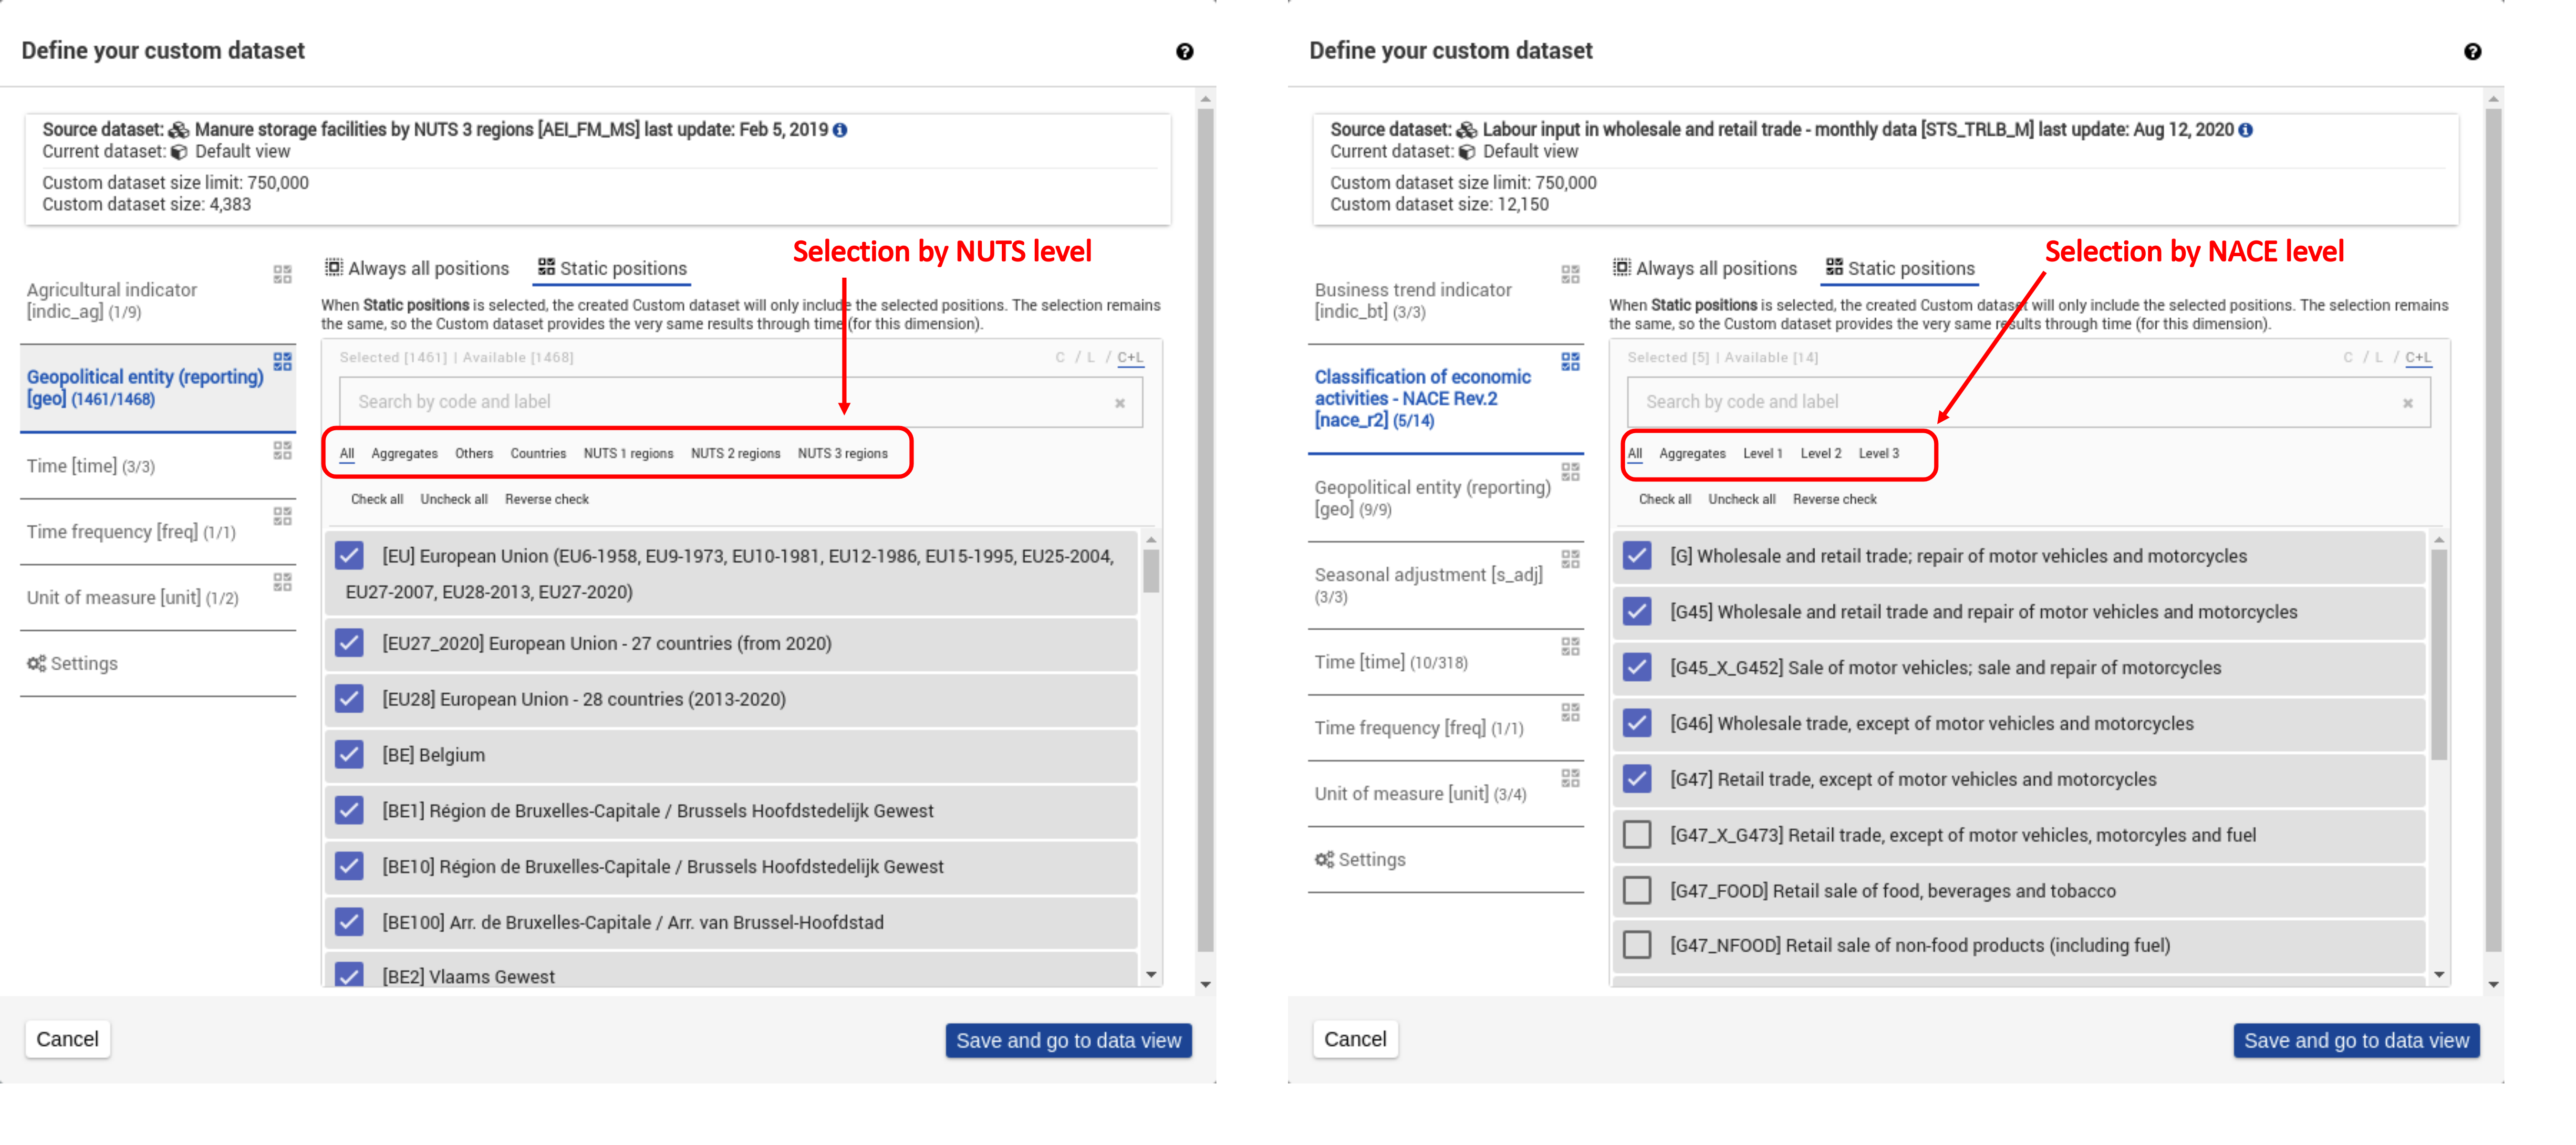
Actions - Selection - Selection by level on NUTS and NACE - Selection tab

Actions - Format

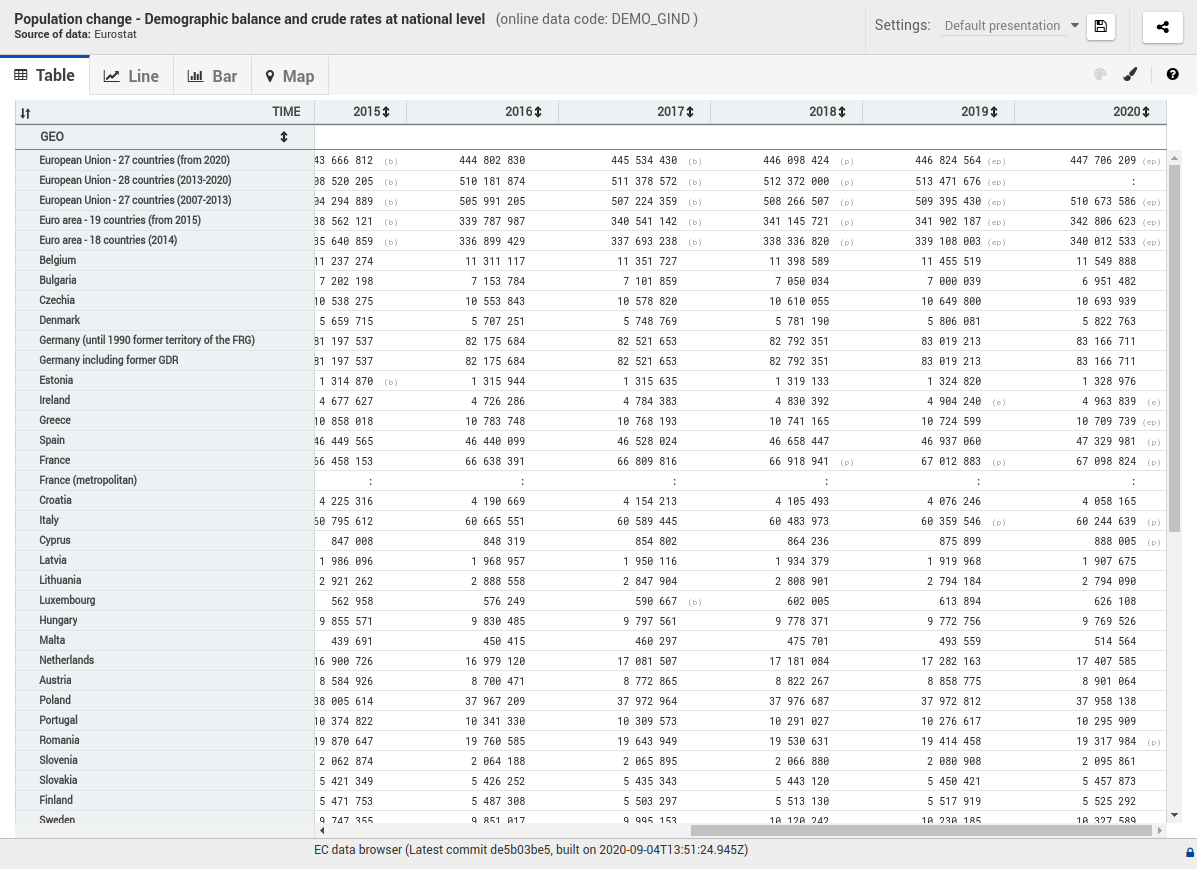
Visualisations
4 direct access visualisations:
Table
Line chart
Bar chart
Map

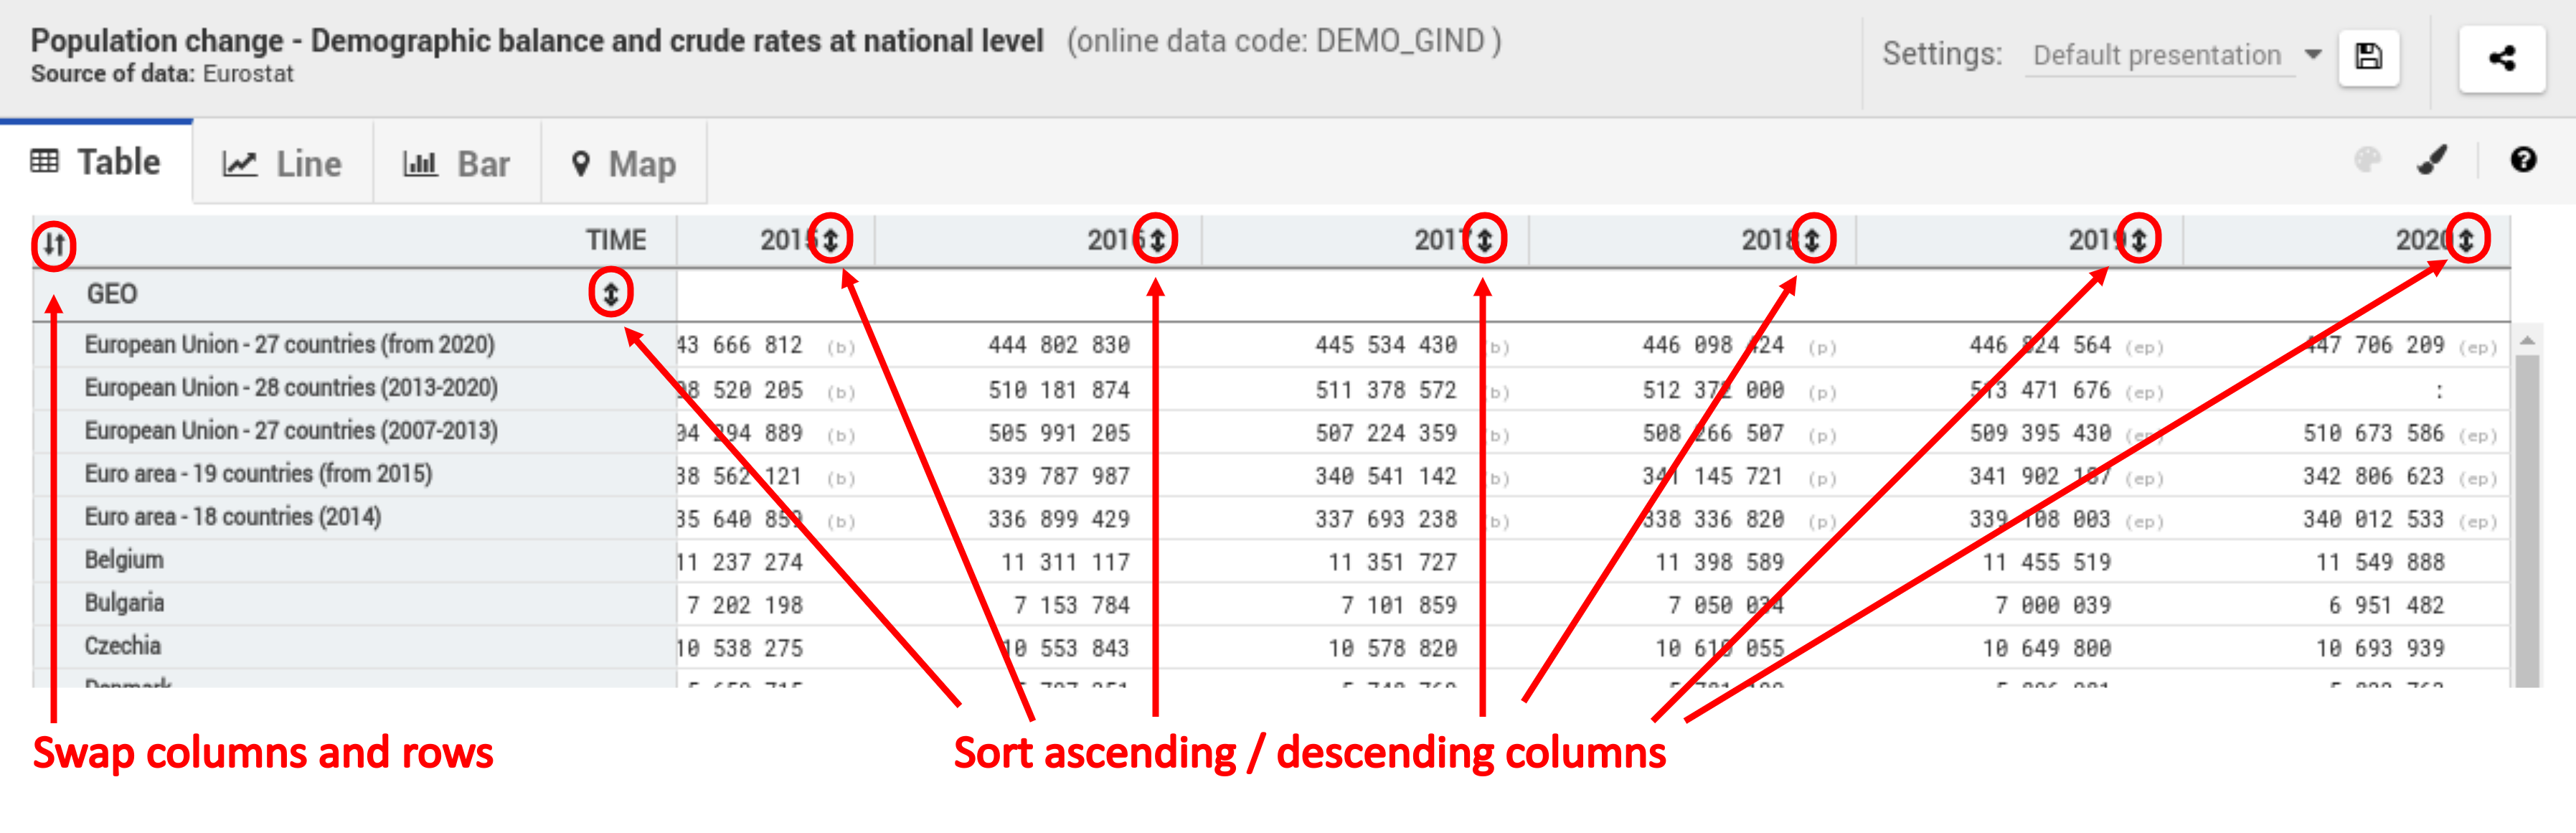
Visualisations - Table
Visualisations - Table - layout
Change layout via table visualisation
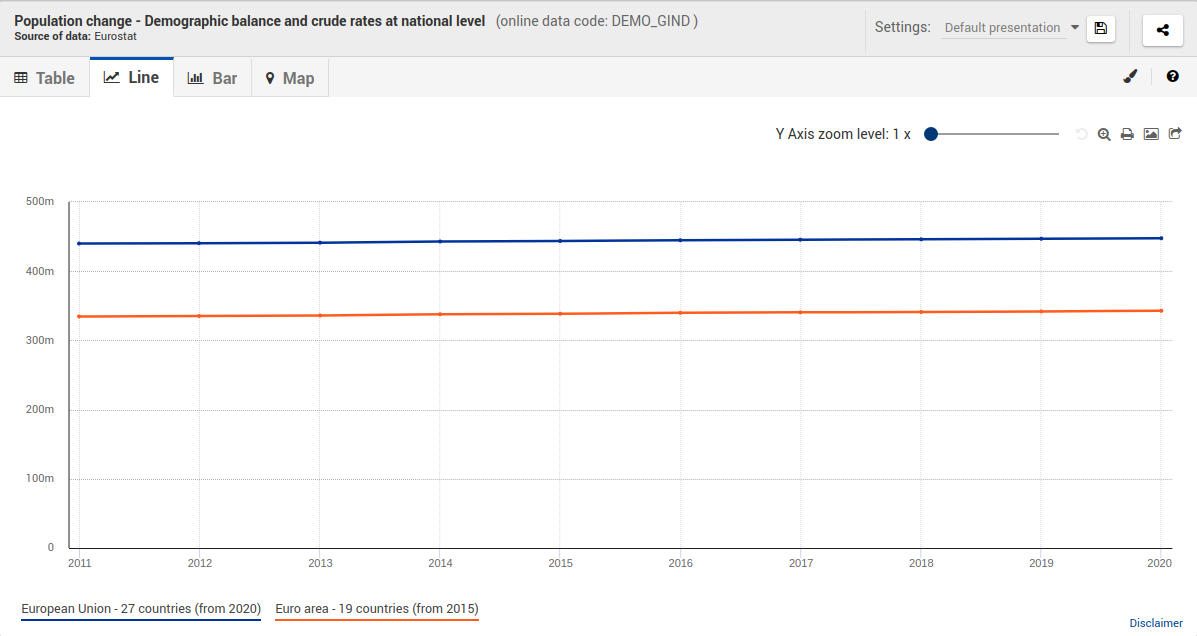
Visualisations - Line chart
Visualisations - Bar chart

Visualisations - Map

Visualisations - Map - NUTS LEVEL

Accessibility
Compliant with Web Content Accessibility Guidelines (WCAG) level AA
Support keyboard navigation
![]() Data Browser is a visualisation tool with graph, map and table. The data visualisation accessibility remains limited.
Data Browser is a visualisation tool with graph, map and table. The data visualisation accessibility remains limited.
Data Browser manipulations
Default view
When opening the dataset, the default view defined by Eurostat is displayed.
This default view uses last 10 positions for TIME dimension and 5 positions for DEMOGRAPHIC INDICATOR dimension.
Reduced dimensions display an icon (+) which allows to customize the dimension positions and then to create a new dataset.

Custom dataset
Online help: How to get more data?
Open custom dataset edition


Custom dataset - selection by level on NUTS and NACE
What are visualisation settings ?
On save and on load, visualisation settings include:
Current visualisation (table, bar chart, line chart or map)
Selection configuration (layout + positions selected)
Format options
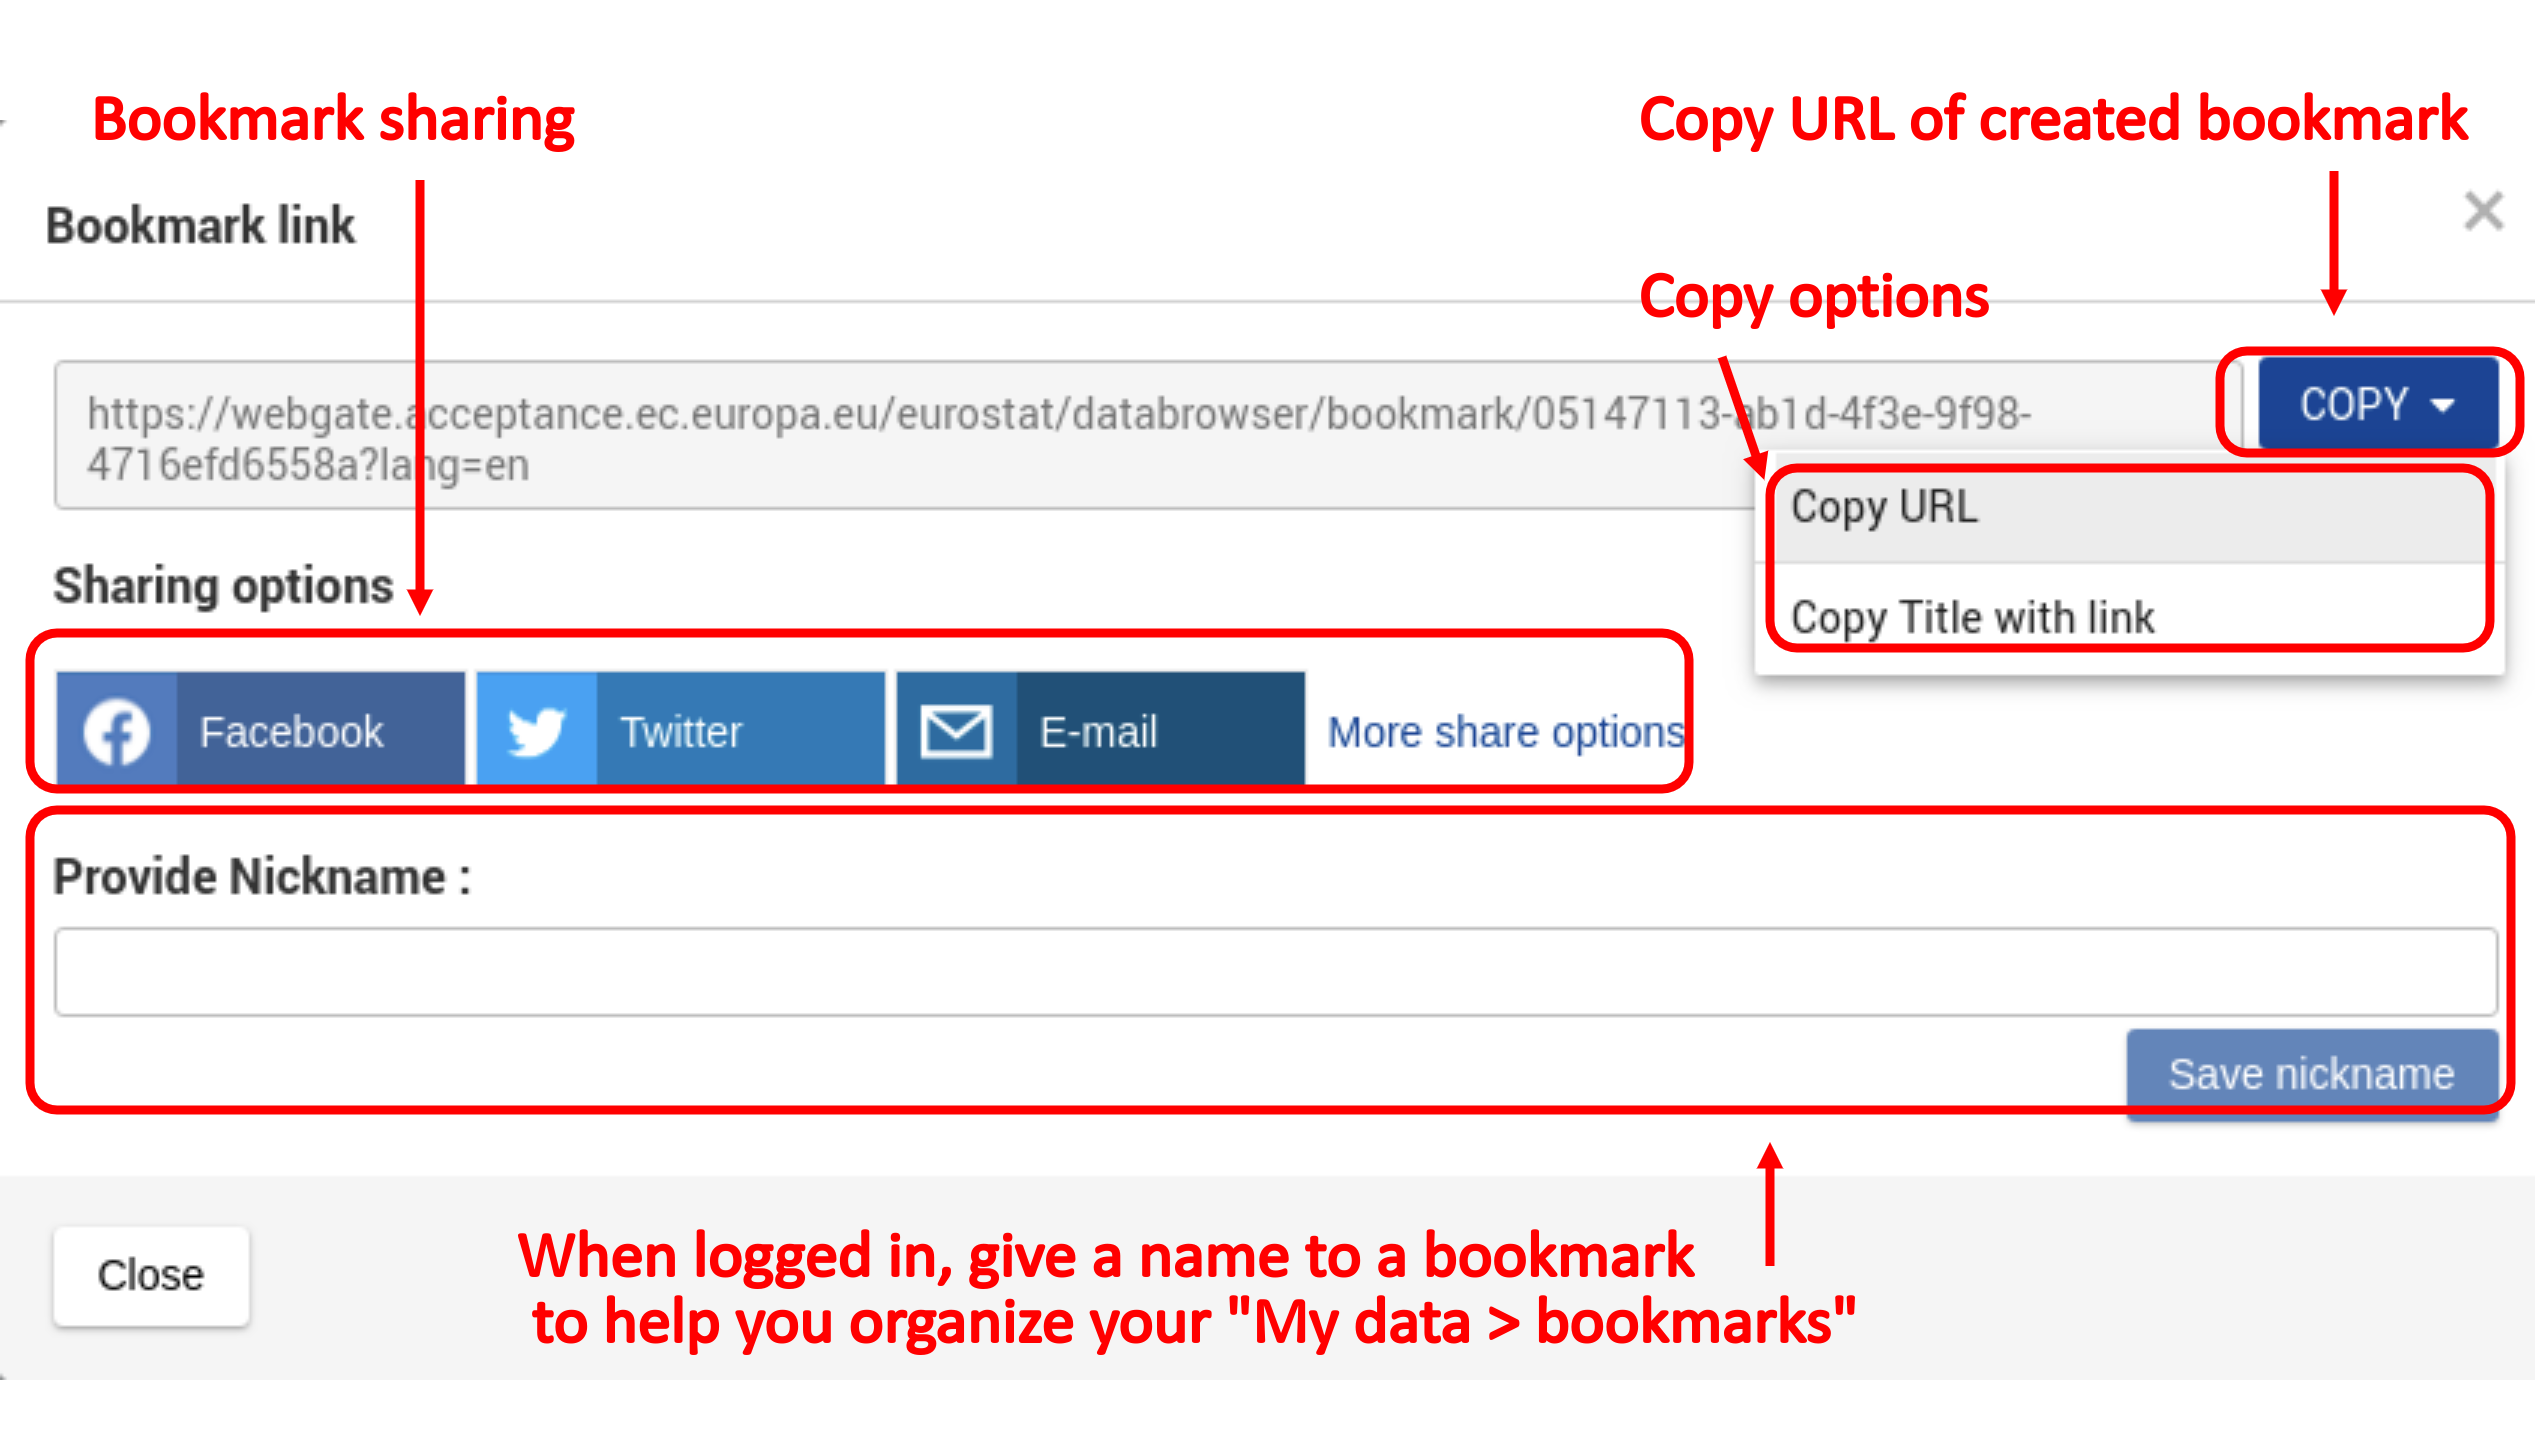
Bookmarks
Online help: How to save for later use? > Manage bookmarks
Open the bookmark creation window:

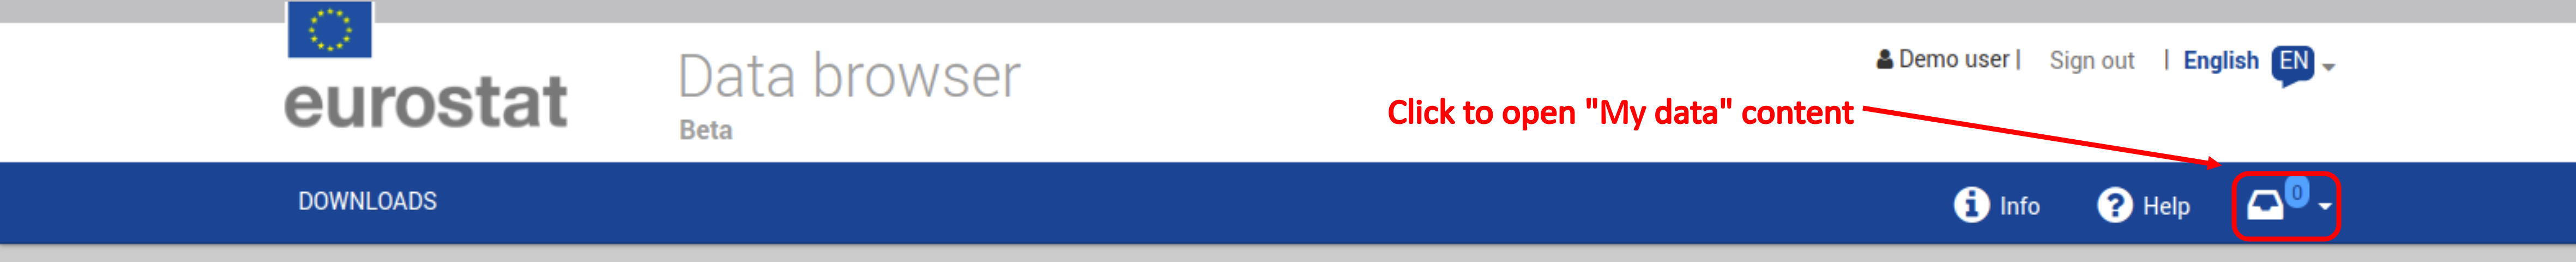
My data
Online help: How to manage the "My data" basket?
Open My data
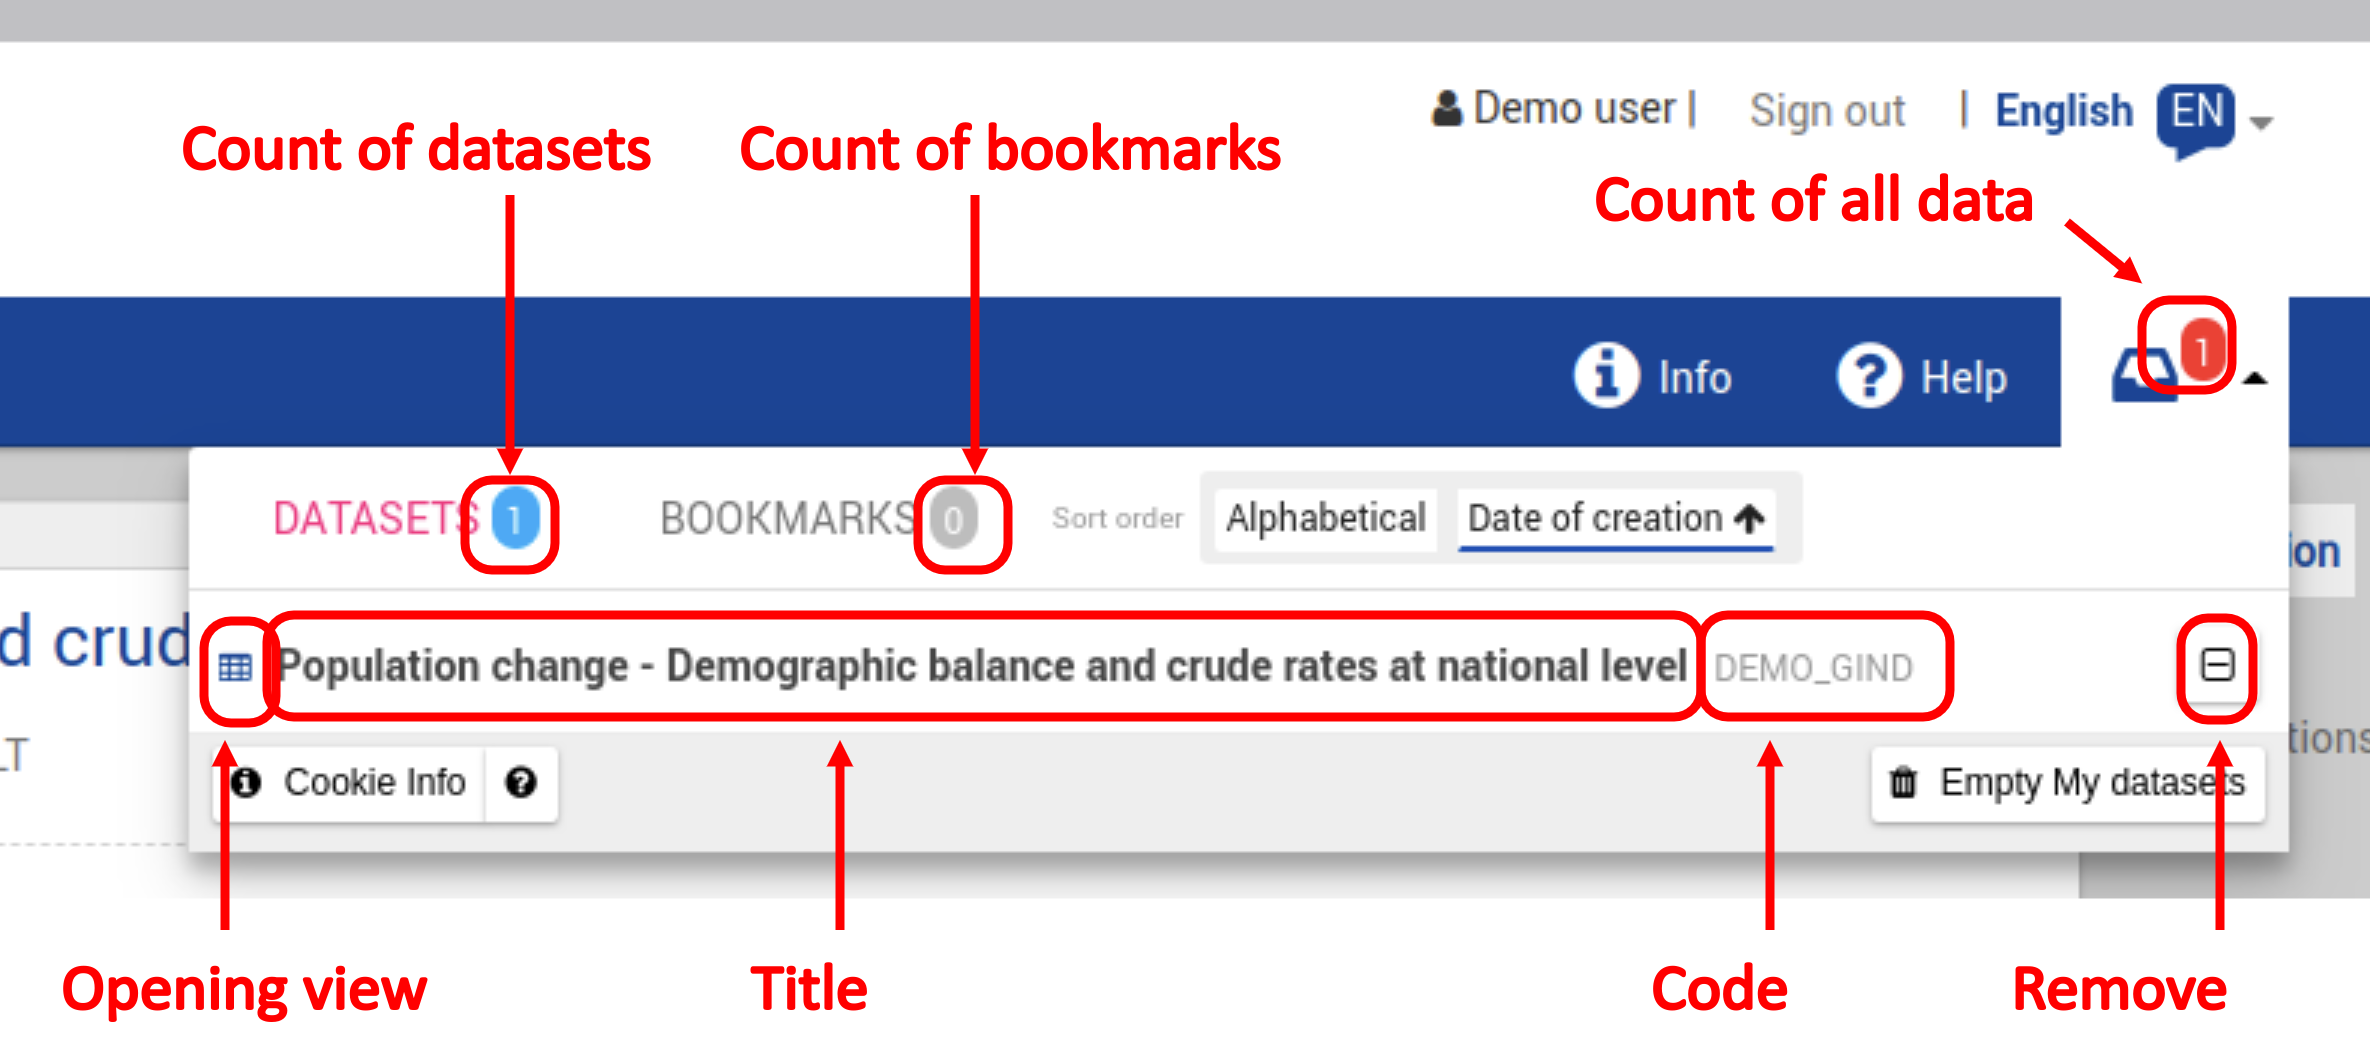
My Data - Content
Datasets
Bookmarks
My data - add to My data
- Datasets

- Custom datasets

- Bookmarks

Data Browser - advanced topics
What about series attributes?
Online help: Series Attribute options
Series attributes can be displayed or hidden via the format tab option:

Series attributes are managed in all visualisations.
Table: displayed in last column with grey background color

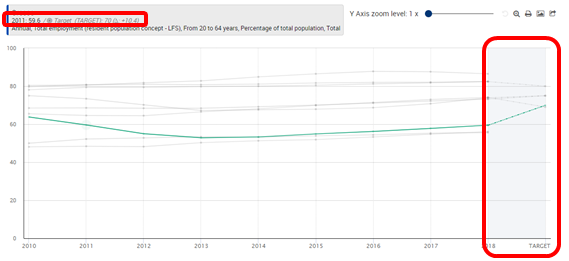
Line chart: displayed in the tooltip when mouse hover a line, and as the right-end of the lines
Bar chart: displayed in the tooltip when mouse hover in bar and as a black stroke on the bar

Map: displayed in the tooltip when mouse hover in country / region

Data on several frequencies - Selection

Data on several frequencies - Visualisation

Build your own view
Deliberately limited to line/bar/map charts to leave the floor to Eurostat Visualisation Tools
Data export + API wider format SDMX, JSON-STAT should help you to reuse Eurostat data in the solution of your choice.
Please contact ESTAT-USER-SUPPORT@ec.europa.eu for further information.
Keep up to date using Eurostat’s daily updates!