...
Line visualisation:
X-Axis zoom: Click on a specific area of the line chart and drag to the right or to the left until the relevant point to zoom on a specific area, then drop the mouse button:

Click on
to get back to the default X-Axis zoom level.
Y-Axis zoom: Use the zoom selector located at the top right of the Line chart:
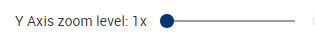
Moving this selector to the right direction increases the Y-Axis zoom level (up to 4x). When the zoom level is increased, a vertical scrollbar appears. This scrollbar provides the vertical movement throughout the zoomed line chart.
Bar visualisation:
X-Axis zoom: Click on a specific area of the bar chart and drag to the right or to the left until the relevant point to zoom on a specific area, then drop the mouse button:

Click on
Map visualisation:
Mouse zoom: Using the mouse wheel, the user can increase or decrease the current zoom level.
Zoom buttons:
Click on