| Table of Contents |
|---|
| Info |
|---|
The following instructions refer to the "Dataset detail" page. |
Data visualisation
Click on Bar tab to visualize the dataset through a bar chart.
...
Click on a bar. This bar gets highlighted and stay highlighted also when mouse hovering other bars.

...
Navigable visualisation
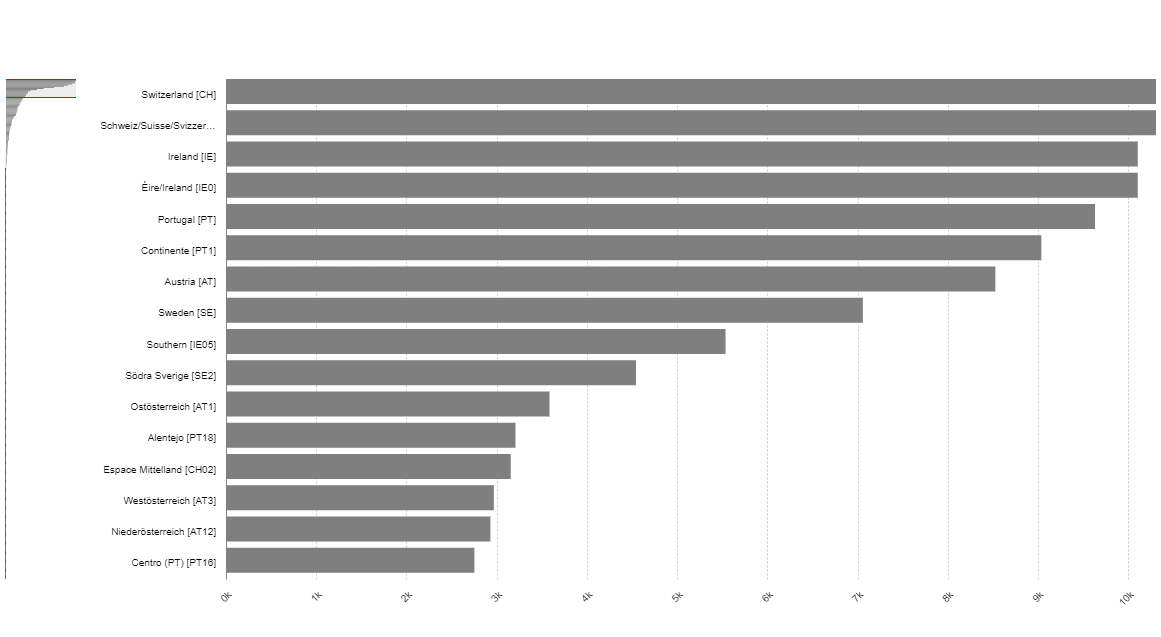
When the chart contains more than 300 bars, a navigation side-panel is added. This side-panel displays the overview of the data and allows to navigate in the chart
Dimensions Management
The X-Axis dimension is used for the categories of the chart
The Series dimension displays below the bar chart as sheets navigation:

Visualisation actions
| Button | Action |
|---|---|
| Print the bar chart with the print feature |
...
| . | |
| Export the bar chart with the export feature |
...
. Different download formats are supported:
| |
| Embed the bar chart with the export feature |

...
The |

...
button Copy is available to automatically select all the 'webtool snippet' code and copy it into the pasteboard. |
| Warning |
|---|
Export and print features have limitations. See this section for more information. |
Dimensions Management
...
The X-Axis dimension displays horizontally.
...
. |
...
The Series dimension displays below the bar chart. Any line can be highlighted by clicking on each position available in the Series:
![]()
| Anchor | ||||
|---|---|---|---|---|
|
Click on Format to set the different format options of the bar chart.

| Info |
|---|
Labelling options, Decimal symbol options and Thousands symbol options are described on this page. |
...
| Info |
|---|
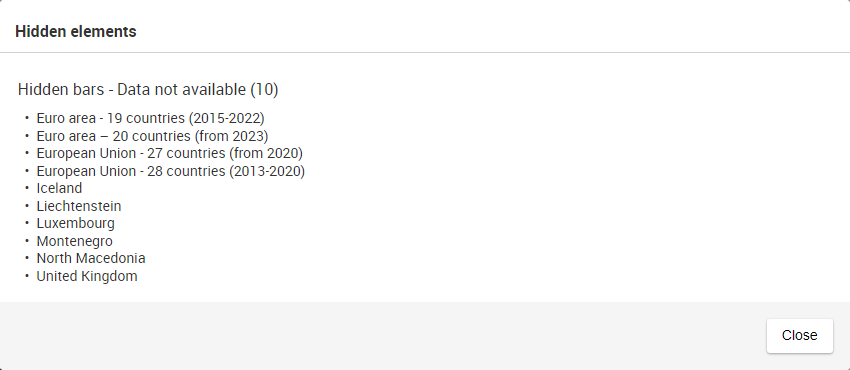
If one or more bar is masked using this option, an orange exclamation mark (
|
...
| Info |
|---|
If one or more bar is masked using this option, an orange exclamation mark (
|

...
If printing the chart in portrait format is necessary, use the following settings:
Orientation: Portrait
Scale: Shrink to fit
If printing the chart in landscape format is necessary, use the following settings:
Orientation: Landscape
Scale: 100%
Print a bar chart with Internet Explorer
...