...
In the Dataset detail page, click
at the top right of the actions section:

A popup similar to this one then appears:

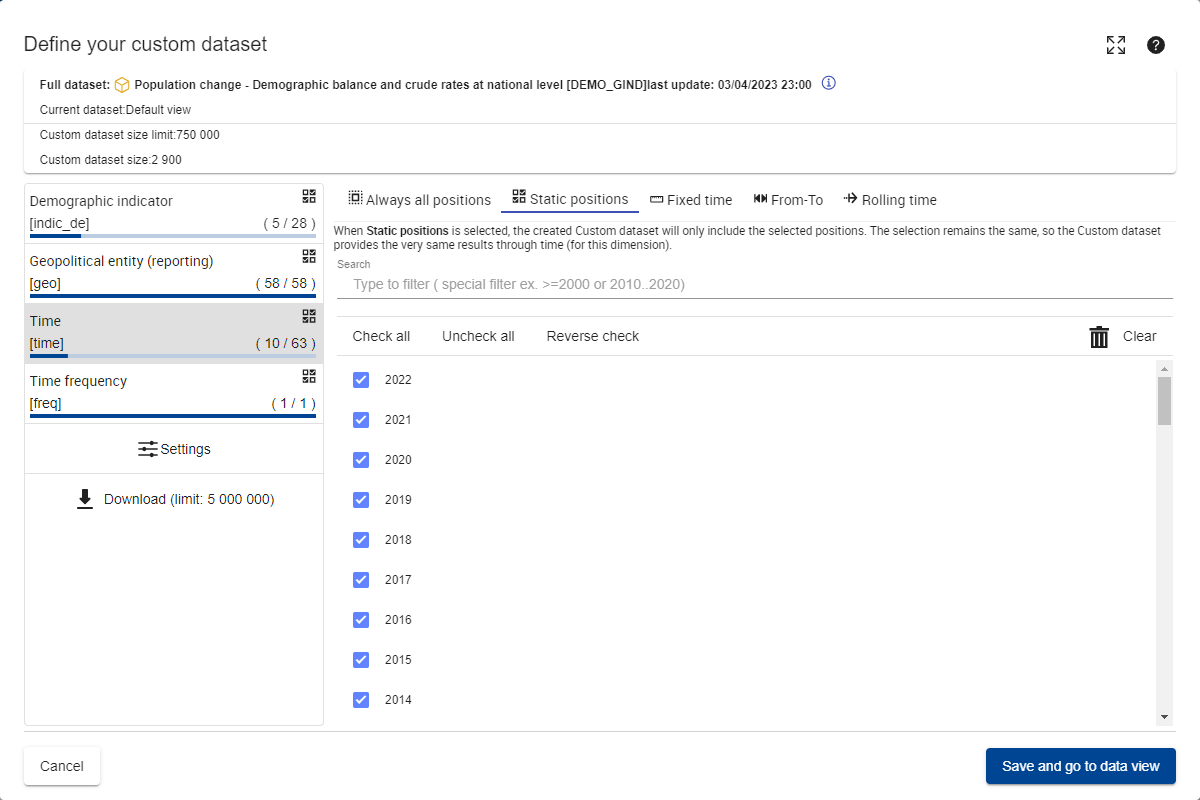
The left part lists all the dimensions. For each dimension, the system displays:
The label of the dimension
Between brackets, the code of the dimension
The amount of positions currently selected and the amount of selectable positions (X/Y)
At the top right corner, the icon which represents the currently selected selection mode for the dimension (see this page for more information on selection modes)
Click on each dimension to select the appropriate selection mode. Depending on the selected selection mode, various options can appear:
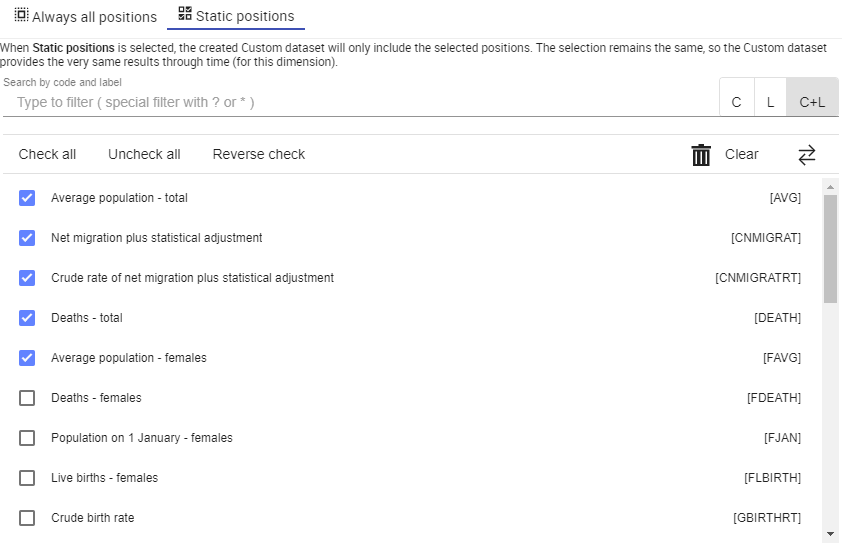
Always all positions: No specific option is available
Static positions: Check in the list all the necessary positions. The selectors and the search feature work as previously described in the visualisation page of the Data Browser (see this page for more information).
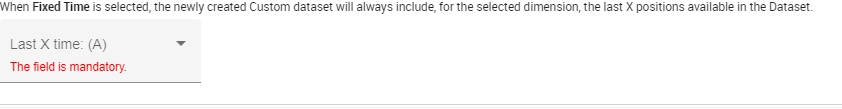
Fixed time (only available on Time dimension): Select the “Last X Time” value.
From-To(only available on Time dimension). Select the Start Time and End Time which match respectively the beginning and the end of the desired timespan interval.

Tip In case of multi-frequency dataset, the user will have to select a Start Time and an End Time for each of the selected Time frequencies.
In every case, the label of the dropdown lists mentions to which frequency the dropdown list is linked (“A” for “Annual” in the example above)
Rolling Time(only available on Time dimension). Select the Start Time which matches the beginning of the desired timespan interval.
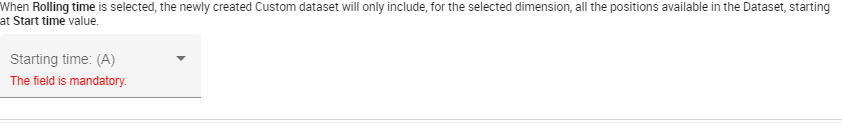
Tip In case of multi-frequency dataset, the user will have to select a Start Time and an End Time for each of the selected Time frequencies.
In every case, the label of the dropdown lists mentions to which frequency the dropdown list is linked (“A” for “Annual” in the example above)
Once all the required settings are set (i.e. at least one selected mode and one position for each dimension), please click on Save to My data and go to data view to create the custom dataset and open it directly in the Data Browser.
...